The CAT Data Portal as a Tool for Climate Accountability
The world is at a crucial juncture in the race to meet the Paris Agreement’s long-term goal of limiting warming to 1.5˚C, and it's critical to understand whether governments' implemented and planned collective actions are sufficient to achieve this goal. At the Climate Action Tracker we regularly analyse data to show where governments are succeeding and where they are falling short in pursuit of the 1.5˚C goal.
Alongside our country profiles, which focus primarily on economy-wide emissions targets and projections, we also host a data portal that visualises a wide array of climate-relevant sectoral indicators for a host of countries. The user can graphically explore a comprehensive dataset of indicators to monitor historical progress in climate action, understand projected trajectories and how those compare to what is needed to limit temperature increase to 1.5°C.
Historical data showing trends over recent years is available for all hosted indicators, while a subset of these show projections under government policies. For seven high emitting economies (US, EU, China, India, South Africa, Indonesia, Brazil), the CAT has derived sectoral benchmarks that reflect levels of action aligned with the Paris Agreement’s 1.5°C long-term temperature goal. When historical data, current policy projections and benchmarks are compared together, it is possible to gauge a country’s progress on ensuring each sector is Paris Agreement compatible, and how much of a gap remains.
Users can zoom in to individual countries, can compare multiple indicators and countries, and can also download the data to make their own graphics. An example is the phasing out of coal-fired power generation in the three key economies of the US, the EU and China, illustrated in Figure 1. The clear misalignment between these countries’ current policy projections and the 1.5°C benchmarks show how much more effort is needed to put their coal-based power sectors on a Paris Agreement-compatible trajectory. China’s coal phase out needs to be brought forward by a couple of decades, and new policies are needed to ensure that the US and EU’s recent progress’ doesn’t stall.

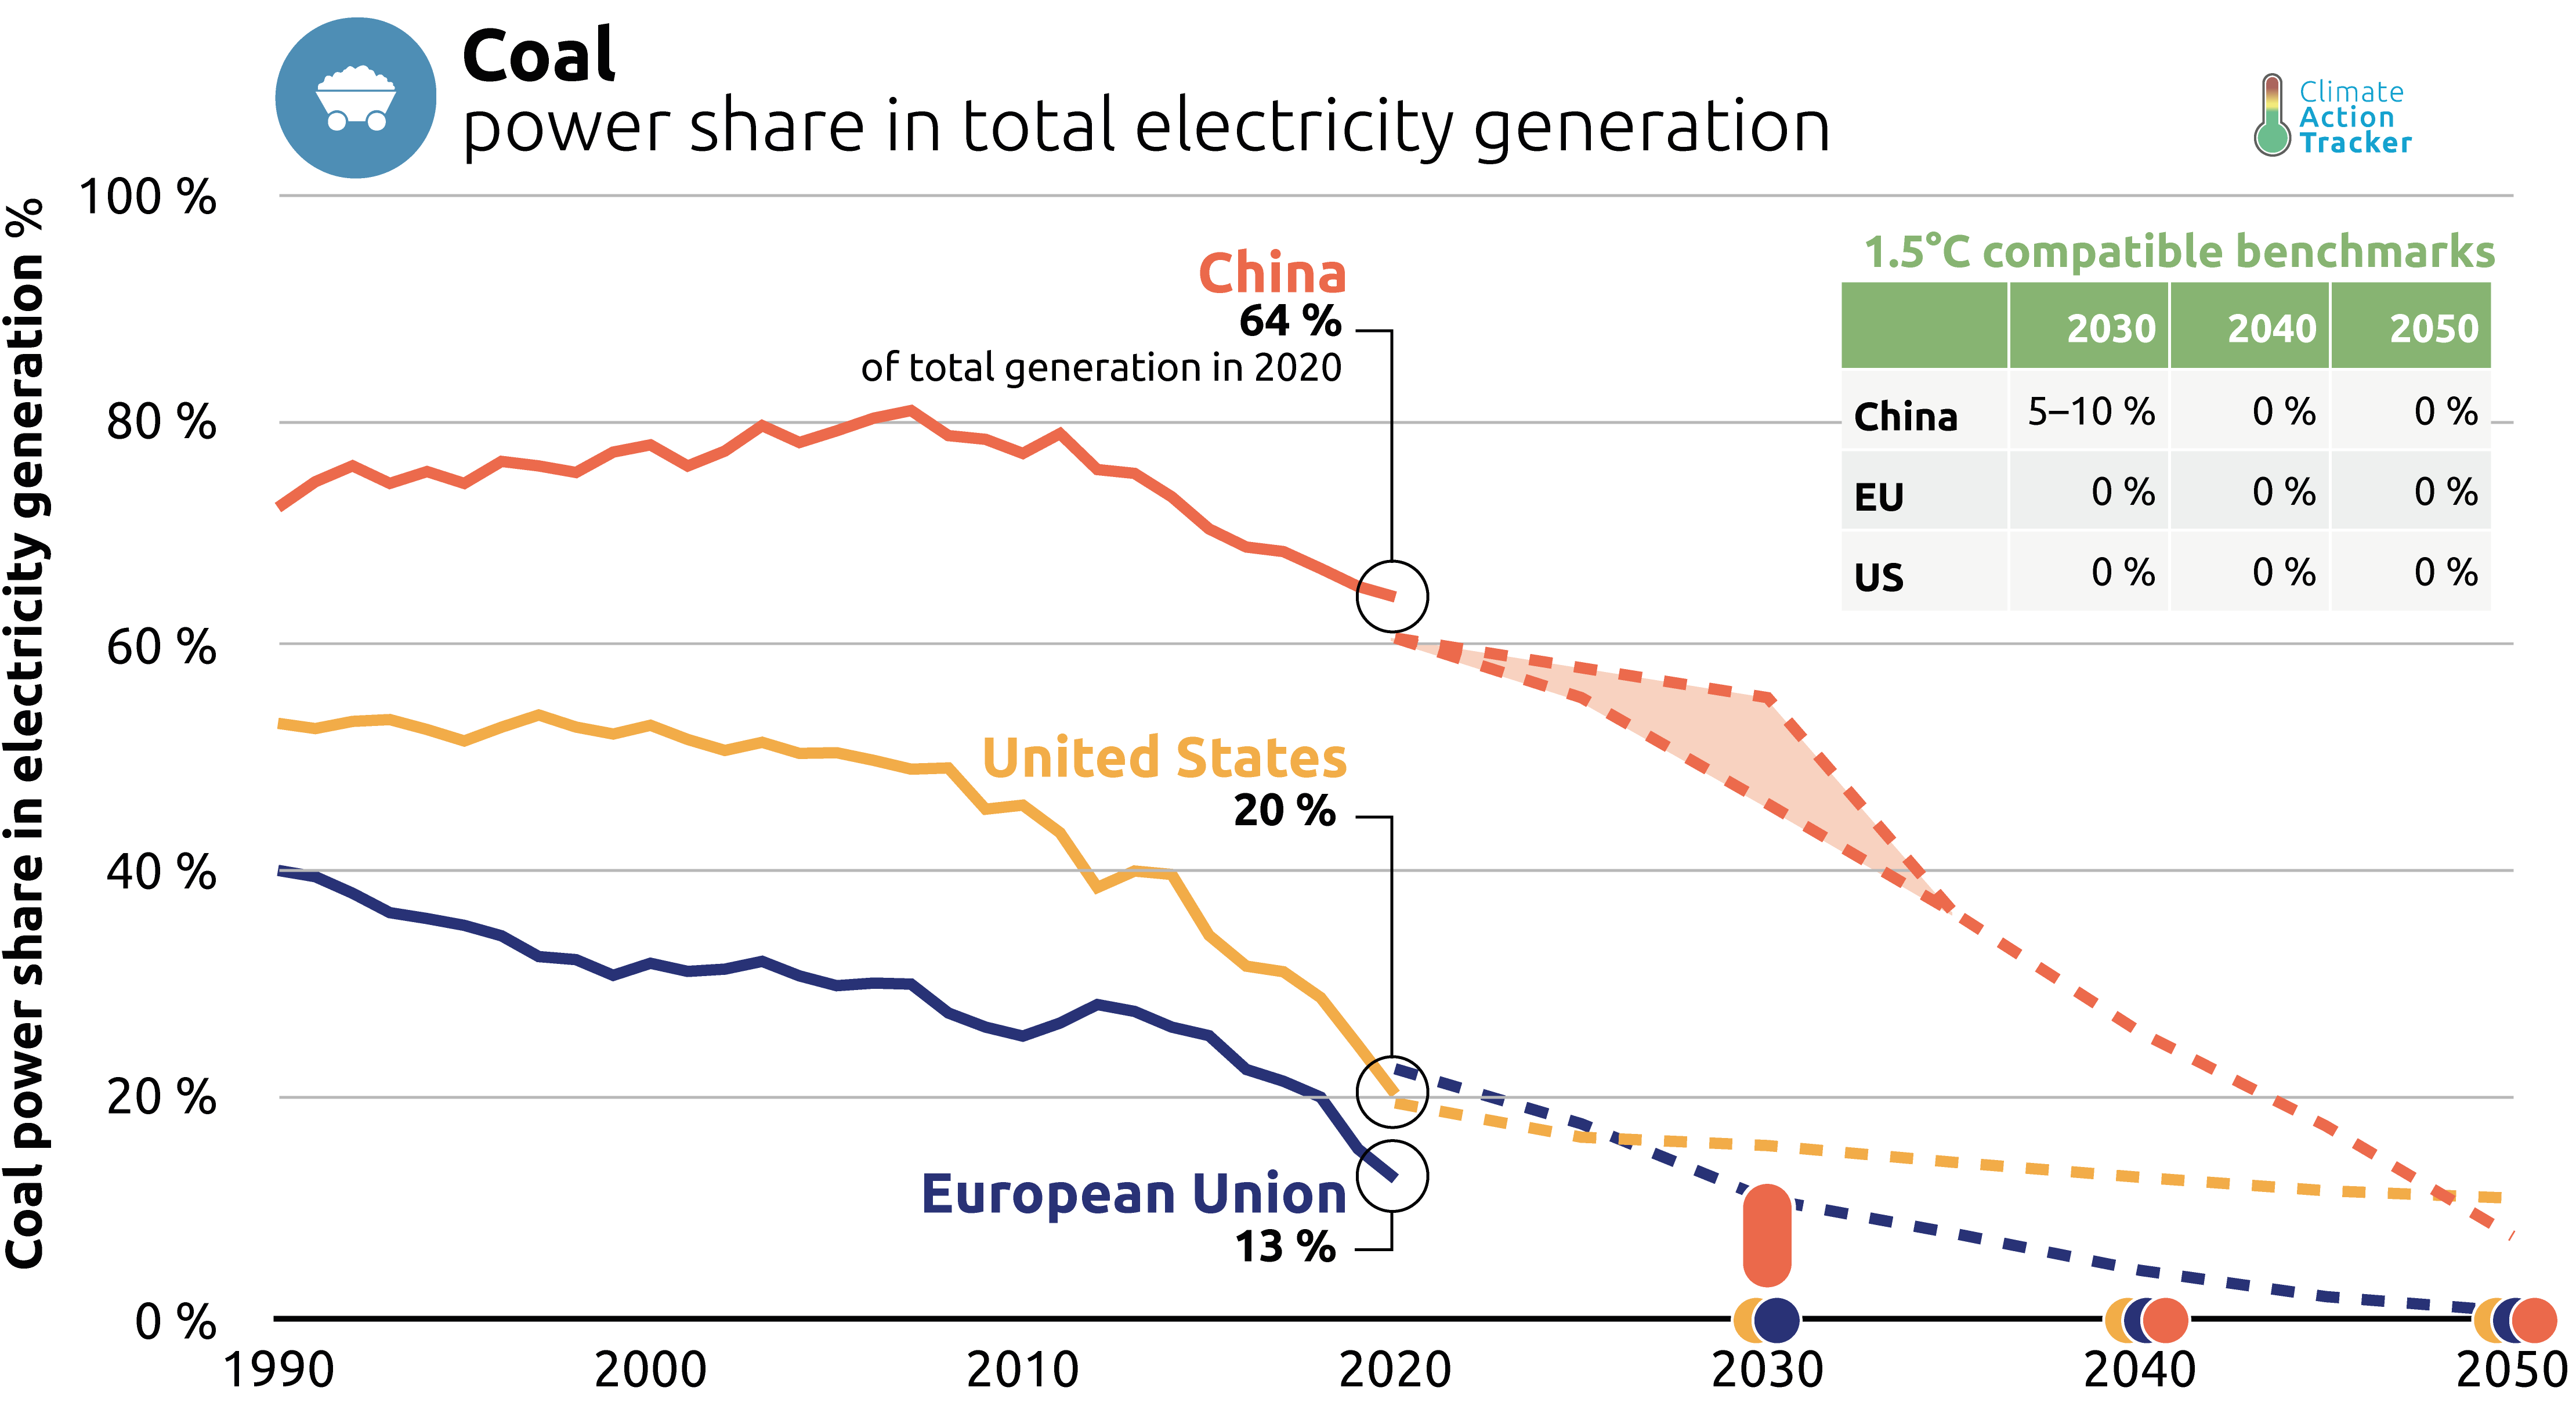
In a recent update to the CAT’s data portal, we uploaded the latest available data and projections for several indicators from the power, transport, agriculture, and forestry sectors, painting a picture of countries’ progress over the last few years, and the impact of recent policy developments on projected outcomes.
This is particularly relevant in the transport sector, as recent data demonstrates the significant progress achieved in the sale of electric vehicles as a share of total light duty vehicle sales (Figure 2). This also illuminates the divergence in performance between countries, with China and the EU making significant strides in recent years, while others like Brazil continue to lag badly. Figure 2 also clearly shows the wide variation in projected improvements under current policies, while no countries are projected to come close to reaching their 1.5°C benchmarks.
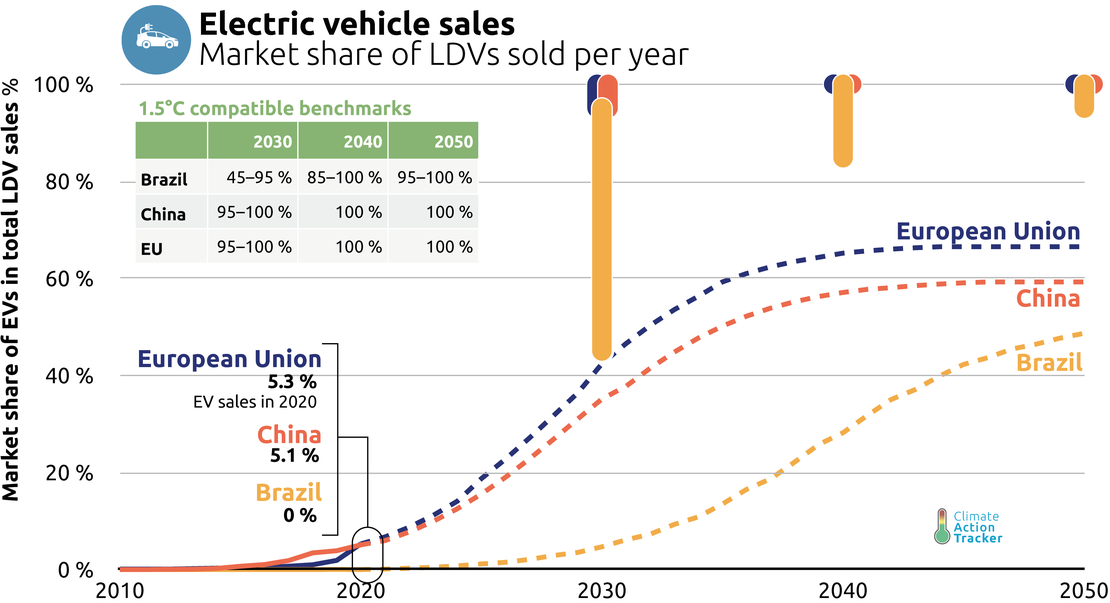
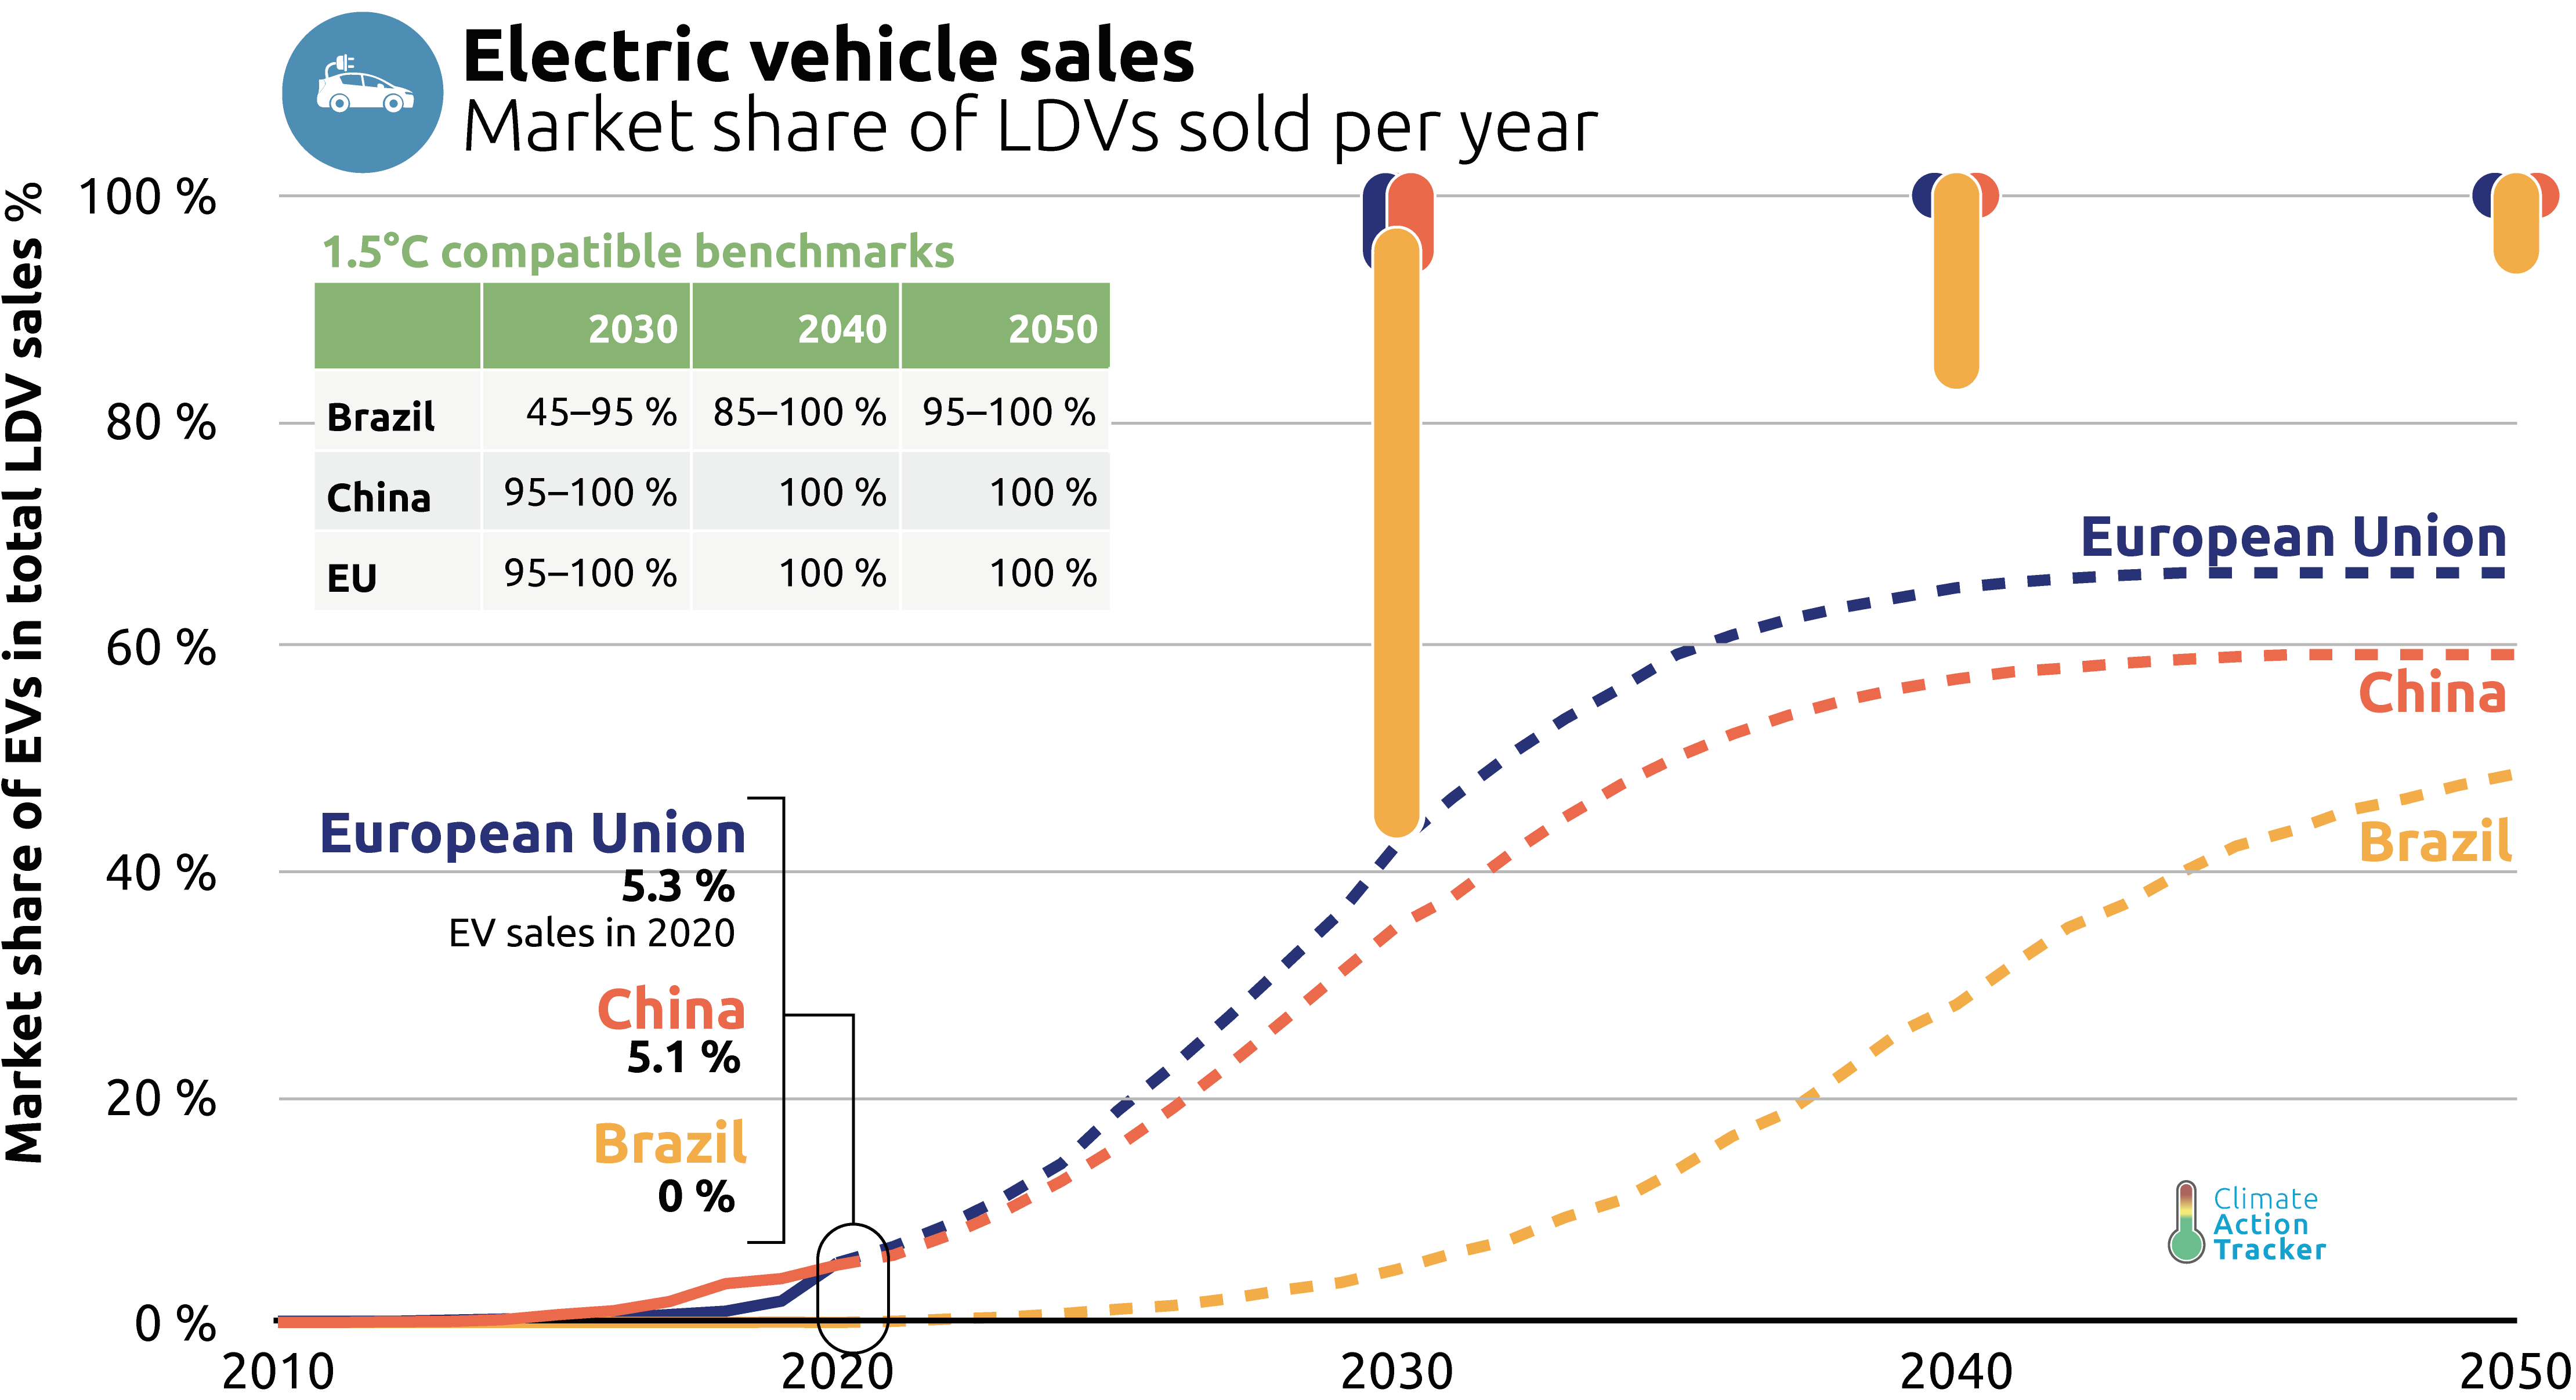
All data hosted on the CAT’s data portal is freely available to download and use for non-commercial purposes. This includes dozens with historical datasets, and with projections under current government policies, providing a useful complement to the country profiles that make up the primary content of the CAT. We collate data from a multitude of sources including government emissions inventories, UN bodies and not-for profit institutions like the IEA and IRENA and then provide it in the context of the aforementioned benchmarks and current policy projections. Journalists, activists, analysts, policy advisors, and researchers among others are likely to find useful data to assist in their respective endeavours.
In addition to the many outputs the CAT produces, the CAT aims to arm these types of stakeholders with the data and knowledge they require to hold political leaders to account and to raise the profile of climate change as an issue with their networks. Tackling the climate crisis requires a concerted effort from a wide range of actors; fostering an enhanced understanding of the many facets of this challenge will sharpen the impact of these actors, and the data portal aims to do just that.
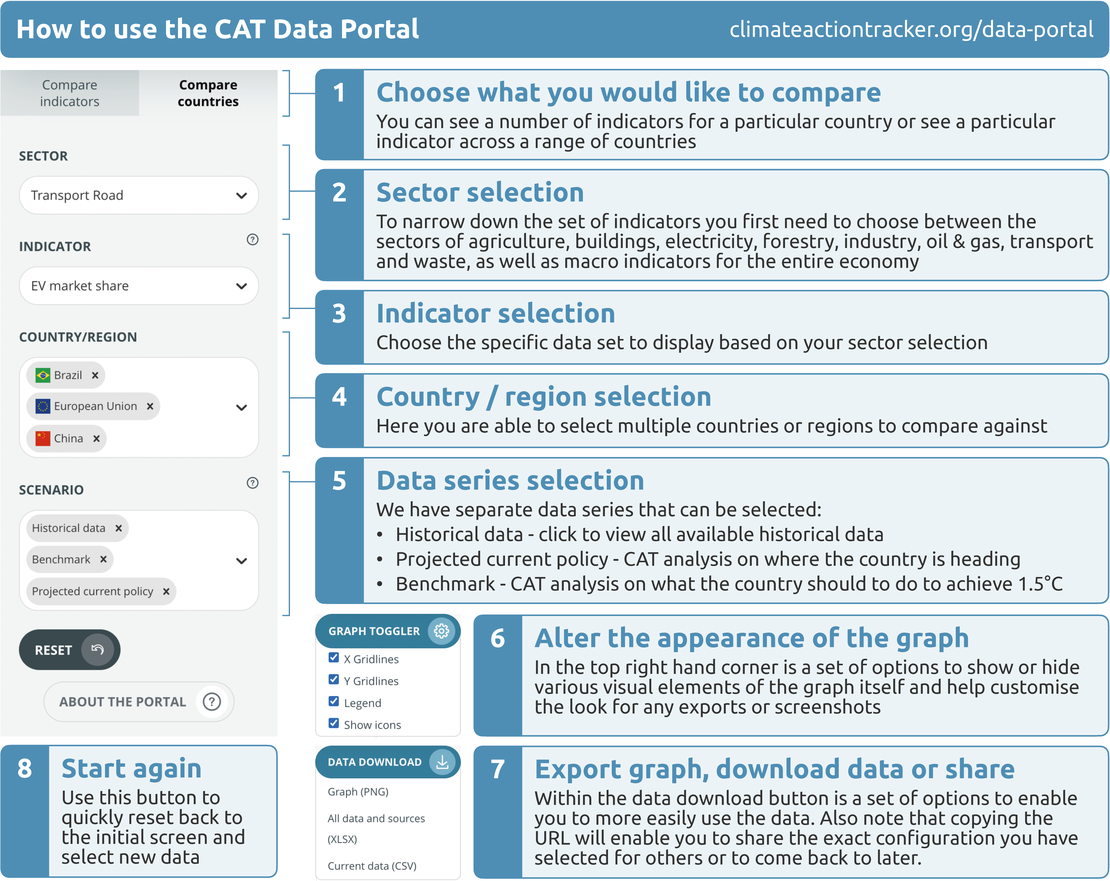
Figure 3 outlines how to produce a graph like that in Figure 2 from the data portal.
Stay informed
Subscribe to our newsletter