Emissions Pathways
Emissions Pathways
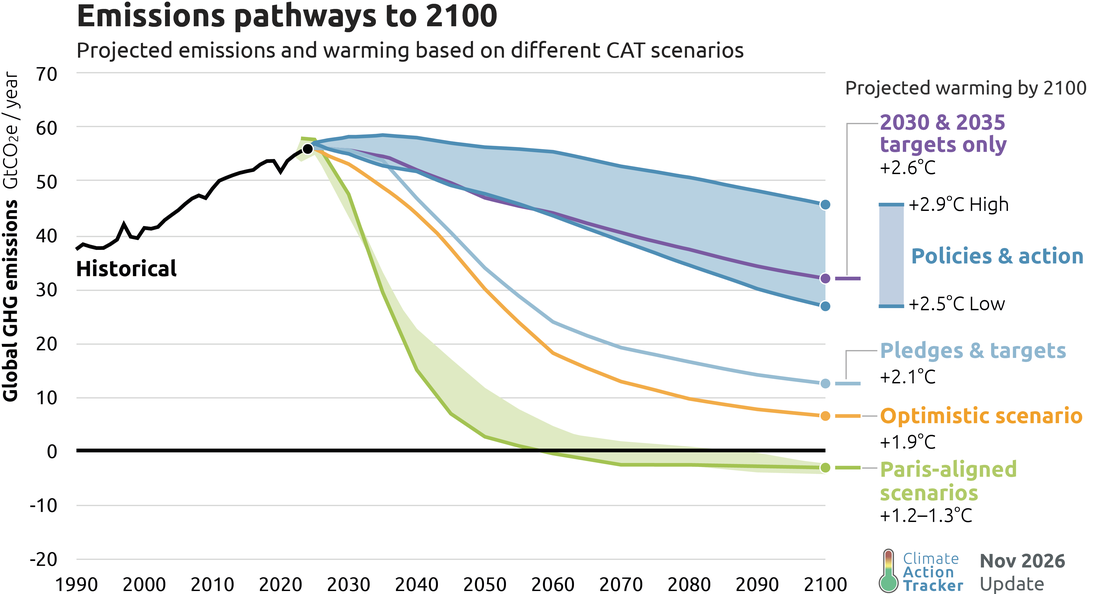
Current policies in place around the world are projected to result in about 2.7°C1 warming above pre-industrial levels. 2030 and 2035 NDCs alone will limit warming to 2.6°C2. When binding long-term or net-zero targets are included (our “pledges and targets” scenario), warming would be limited to about 2.1°C3 above pre-industrial levels.
We also ran an “optimistic” scenario analysing the effect of net zero emissions targets announced in 113 countries. Under the optimistic assumption that governments will achieve these targets, the median warming estimate is 1.9°C.
All these scenario warming estimates are with a 50% chance that the calculated temperature would be exceeded if the given emissions pathway is followed.
See our November 2026 briefing for full details.
There remains a substantial gap between what governments have promised to do and the total level of actions they have undertaken to date. Furthermore, both the current policy and pledge trajectories lie well above emissions pathways aligned with the Paris Agreement long-term temperature goal.
The new reality of Paris-aligned pathways, instead of Paris-compatible
The 1.5°C limit has served as a guiding light to prevent the worst excesses of climate change, providing a lifeline for vulnerable communities and ecosystems across the world.
Had globally coordinated action begun in 2020, as the AR6 pathways assumed, warming could have been held to 1.5°C with no or limited overshoot. That window has closed. Overshoot is now unavoidable, but its shape and duration are now down to the actions governments take in the next critical years.
To reflect the current reality that global emissions still have not peaked, and long-term warming is expected to cross the Paris Agreement’s 1.5°C limit around 2030, there is a new generation of emissions pathways which assess how to limit overshoot of 1.5°C. We consider them Paris-aligned, not Paris-compatible.
These new Paris-aligned climate models show higher emissions in 2030, followed by a steeper drop post-2030 to make up for this decade’s lack of action, and use CDR to reach net negative CO₂ emissions and bring temperatures down from the peak. These models’ post-2030 emissions reductions are dramatic, but they demonstrate that it is still possible to limit global warming to 1.5°C in the longer term. The cost of renewable energy and other zero-carbon technologies has plummeted providing countries with a realistic means of achieving the deep decarbonisation needed to align with 1.5°C (IEA, 2026; IRENA, 2026). Every year of delay shrinks the future emissions budget, meaning the curve gets steeper with each year of inaction (Climate Analytics and PIK, 2025). A just and orderly transition requires early action, and central to this is a transition away from fossil fuels.
We construct our “Paris-aligned” range from a range of scenarios that meet the “Paris-aligned” definition outlined above. These are drawn from the Highest Possible Ambition (HPA) scenario and the latest Very Low (VL) scenarios from the CMIP7 ensemble4. The “Paris-aligned” line is the 2025 “Highest Possible Ambition” scenario (HPA-2025) developed by Climate Analytics and the Potsdam Institute for Climate Impact Research (PIK) (Climate Analytics and PIK, 2025). This scenario shows the highest possible ambition in a wider set of these new scenarios.
The cost of the past five years of delay is clear from a comparison with the AR6 pathways: peak warming at least 0.1°C higher, an overshoot around a decade longer, and roughly three times the cumulative exposure to warming above 1.5°C (Climate Analytics and PIK, 2025).
This new generation of overshoot pathways offers governments clear, technically feasible routes to cutting their emissions and limiting warming. They also offer a real chance to break the dependence on volatile, crisis-laden fossil fuel markets. While the path may be clear, it relies on ambitious governments willing to walk it.
For more details, please see the Annex of our latest global temperature update briefing.
Footnotes
1 | 2.7°C is the median of the combined low and high current policy scenarios.
2 | For those countries, who are overachieving their NDCs, we take the upper end of their current policy projections as the limit. We project the global effects beyond the NDC timeframes assuming policies of a similar strength are implemented through to the end of the century. We show the upper end of the range for this scenario to show the more conservative estimate.
3 | We show the upper end of the range for this scenario to show the more conservative estimate. If the more ambitious end of the pledges and targets range was reached, warming could be limited to a median of 1.8°C. This includes the stronger end of country NDCs where a reduction range is specified and mitigation commitments that are conditional on finance.
4 | We do not currently include all VL scenarios in our Paris-aligned scenario set. This is because 3 of them do not reach net zero GHGs by 2100, and 5 of them do not limit warming in 2100 to below 1.5ºC with a >66% probability, which is our threshold for classifying a scenario as “below” 1.5ºC. The VL scenarios were not explicitly designed to meet these thresholds, and many of those which do not remain very close to the thresholds (e.g. only 0.02ºC above the end of century limit for “below” 1.5ºC). They would therefore count as very close to Paris-aligned. Nevertheless, in this report, we focus on the subset of Very Low scenarios which meet these thresholds fully, which gives overall 5 scenarios for analysis (HPA and 4 VL scenarios). This does not negate the value of the Very Low scenarios which do not specifically meet these thresholds. In particular, their role in identifying the near-term action required to limit overshoot, such as electrification, remains high.
Further information
For more results linked to our most recent Global temperature update see:
For the latest on NDC updates, please refer to our Climate Target Update Tracker as well as our briefing detailing our 2030 and 2035 NDC target recommendations for major emitters to align to 1.5°C. For the latest in country developments, see our country assessments.
For more information on the global emissions and temperature pathways and how they are calculated, please refer to our methodology section.
If you use the provided data or any of the graphs provided on this website, please make sure to reference the Climate Action Tracker and the Climate Analytics / NewClimate Institute team!
Last update: 12 November 2026
Suggested citation
Climate Action Tracker (2026). Emissions pathways to 2100: Projected emissions and warming based on different CAT scenarios. November 2026. Available at: https://climateactiontracker.org/global/emissions-pathways/.
Copyright ©2026 by Climate Analytics and NewClimate Institute. All rights reserved.
Stay informed
Subscribe to our newsletter