CAT Thermometer
The CAT thermometer explained
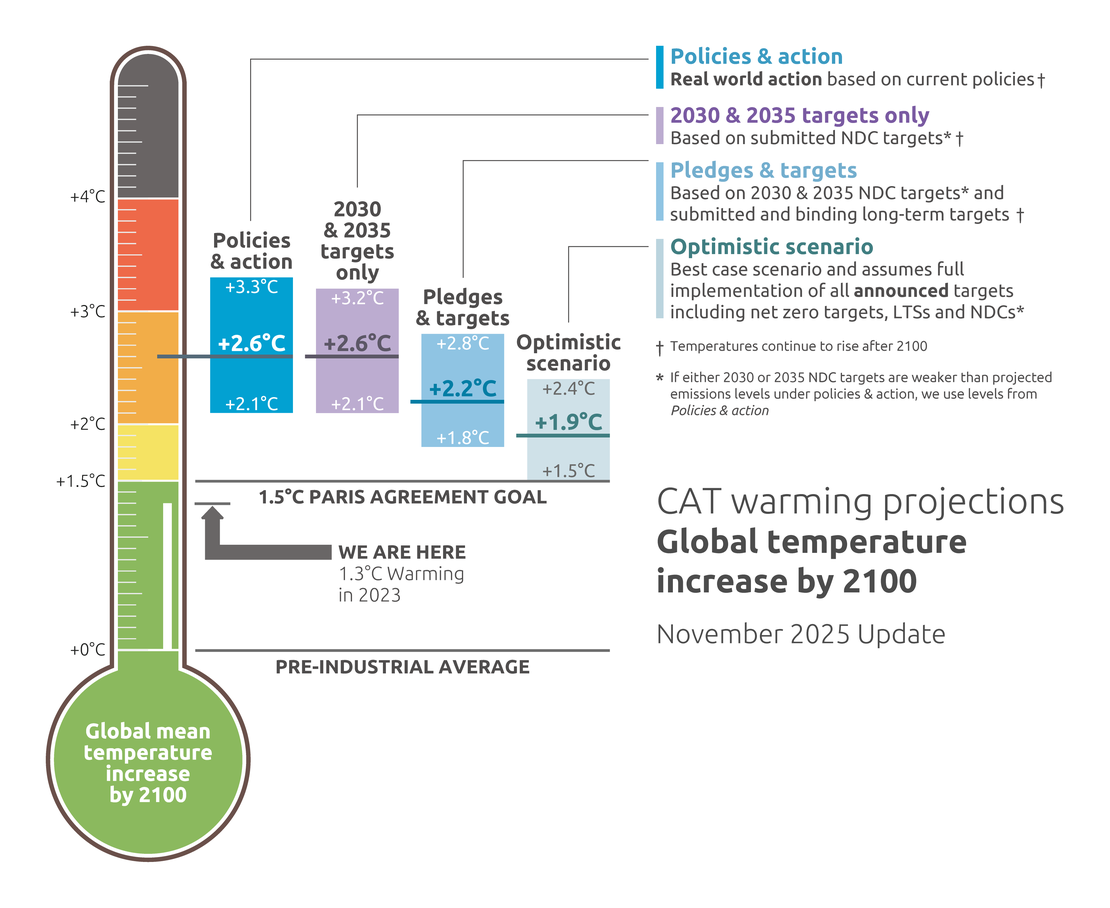
The temperatures on the CAT thermometer are ‘median’ warming estimates in 2100. This means that there is a 50% chance that the calculated temperature would be exceeded if the given emissions pathway is followed.
For example, there is a 50% chance that warming associated with our pledges and targets scenario exceeds 2.2°C in 2100.
Using probabilities to provide more information
The ‘median’ is based on the probability distribution generated by the climate model (MAGICC7) when it takes into account uncertainties in our knowledge of climate sensitivity, the carbon cycle, and effect of greenhouse gases, aerosols, and other factors that are used to calculate the temperatures. The probability distribution enables us to provide more information for policy makers and stakeholders about the likelihood of goals being met, or specific temperatures being exceeded.
Based on the “2030 and 2035 targets only” sceanrio, end of century will be 2.6°C, with a 50% chance of being higher or lower. Our knowledge of the climate system tells us that there is a 66% chance of it being 2.8°C or higher and a 10% chance of being 3.5°C or higher. If one includes binding long-term targets (our “pledges and targets” scenario), we estimate end of century warming to be 2.2°C, with only a 15% chance of warming staying below 2°C (at 1.8°C) and 90% chance of exceeding 3.0°C.
The CAT has also analysed the effect of net zero emission targets adopted or under discussion in over 140 countries and found that warming could be as low as 1.9˚C by 2100. While an estimate that comes under the 2°C level is an important milestone, it must be stressed that this is based on only a 50 / 50 chance that warming will indeed be limited to 1.9°C by 2100 and 2.0°C at its peak. While the level of warming in 2100, in probabilistic terms, is 66% likely to be below 2.1°C, the same is not true of the peak level of warming in this century.
What governments need to do to achieve the global goal
The IPCC Special Report on 1.5°C shows that steep emissions reductions are urgent, but feasible, and will still deliver the many benefits associated with 1.5°C-compatible pathways in terms of avoided climate-change impacts, as well as cleaner air, increased employment in the renewable energy sector, access to modern energy, etc.
The IPCC Special Report on 1.5°C shows that even starting from emission levels implied by NDCs and current policy projections, 1.5°C and 2°C pathways are still technically feasible. However, the resulting emission pathways are increasingly expensive as they are not consistent with the most cost-efficient policies. Slower-than-optimal emission reductions early on need to be followed by faster reductions later on, effectively leading to significantly higher costs for the period 2030–2050 than would otherwise be needed. While the challenges are significant, limiting warming to below 1.5°C by the end of the century is still feasible from current emissions levels. However, with every decade lost, these challenges and costs rise and will, at some point, become insurmountable with warming locked in to 1.5 or 2°C and above.
Further information
For more results linked to our most recent Global temperature update see:
- Our full global temperature update briefing
- Emissions and temperature pathway results to 2100
- Emissions gaps for 2035
For the latest on NDC updates, please refer to our Climate Target Update Tracker as well as our briefing detailing our 2030 and 2035 NDC target recommendations for major emitters to align to 1.5°C. For the latest in country developments, see our country assessments.
For more information on the global emission pathways and how they are calculated, please see refer to our methodology section.
If you use the provided data or any of the graphs provided on this website, please make sure to reference the Climate Action Tracker and the Climate Analytics / NewClimate Institute team!
Last update: 13 November 2025
Suggested citation
Climate Action Tracker (2025). The CAT Thermometer. November 2025. Available at: https://climateactiontracker.org/global/cat-thermometer/
Copyright © 2025 by Climate Analytics and NewClimate Institute. All rights reserved
Stay informed
Subscribe to our newsletter