Decarbonisation data portal relaunch
Overview
The CAT has launched our newly redesigned decarbonisation data portal. The new design improves user-friendliness and makes our extensive dataset even more accessible. Look out for updated data coming summer 2019!
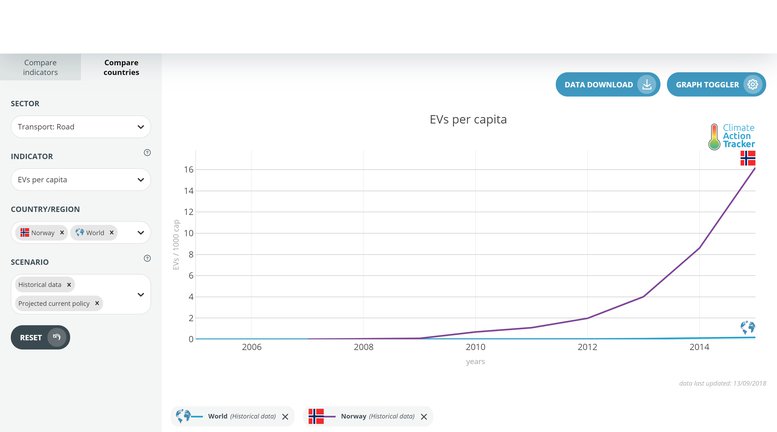
The data portal is dedicated to tracking the underlying drivers of greenhouse gas emissions. It’s clear that to stay within the Paris Agreement’s temperature limit, urgent action in needed in all sectors. Through the data portal, users can explore and track historical and projected decarbonisation progress in 13 economic sectors through data series of 41 indicators in 34 countries and 6 regions (see this table for an overview of what data is available). All of the data is available for download.
Indicator comparison
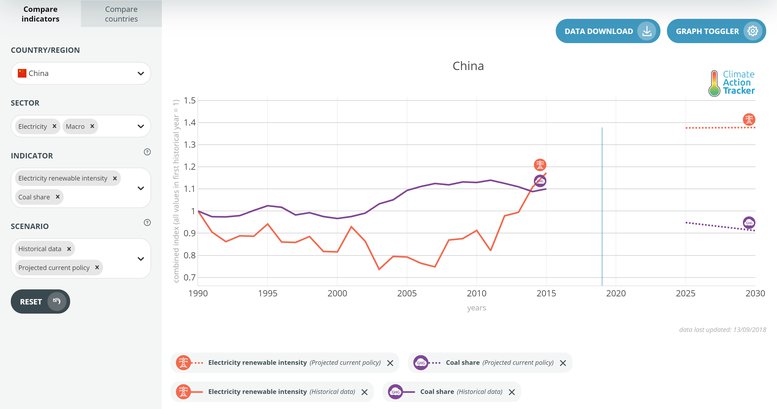
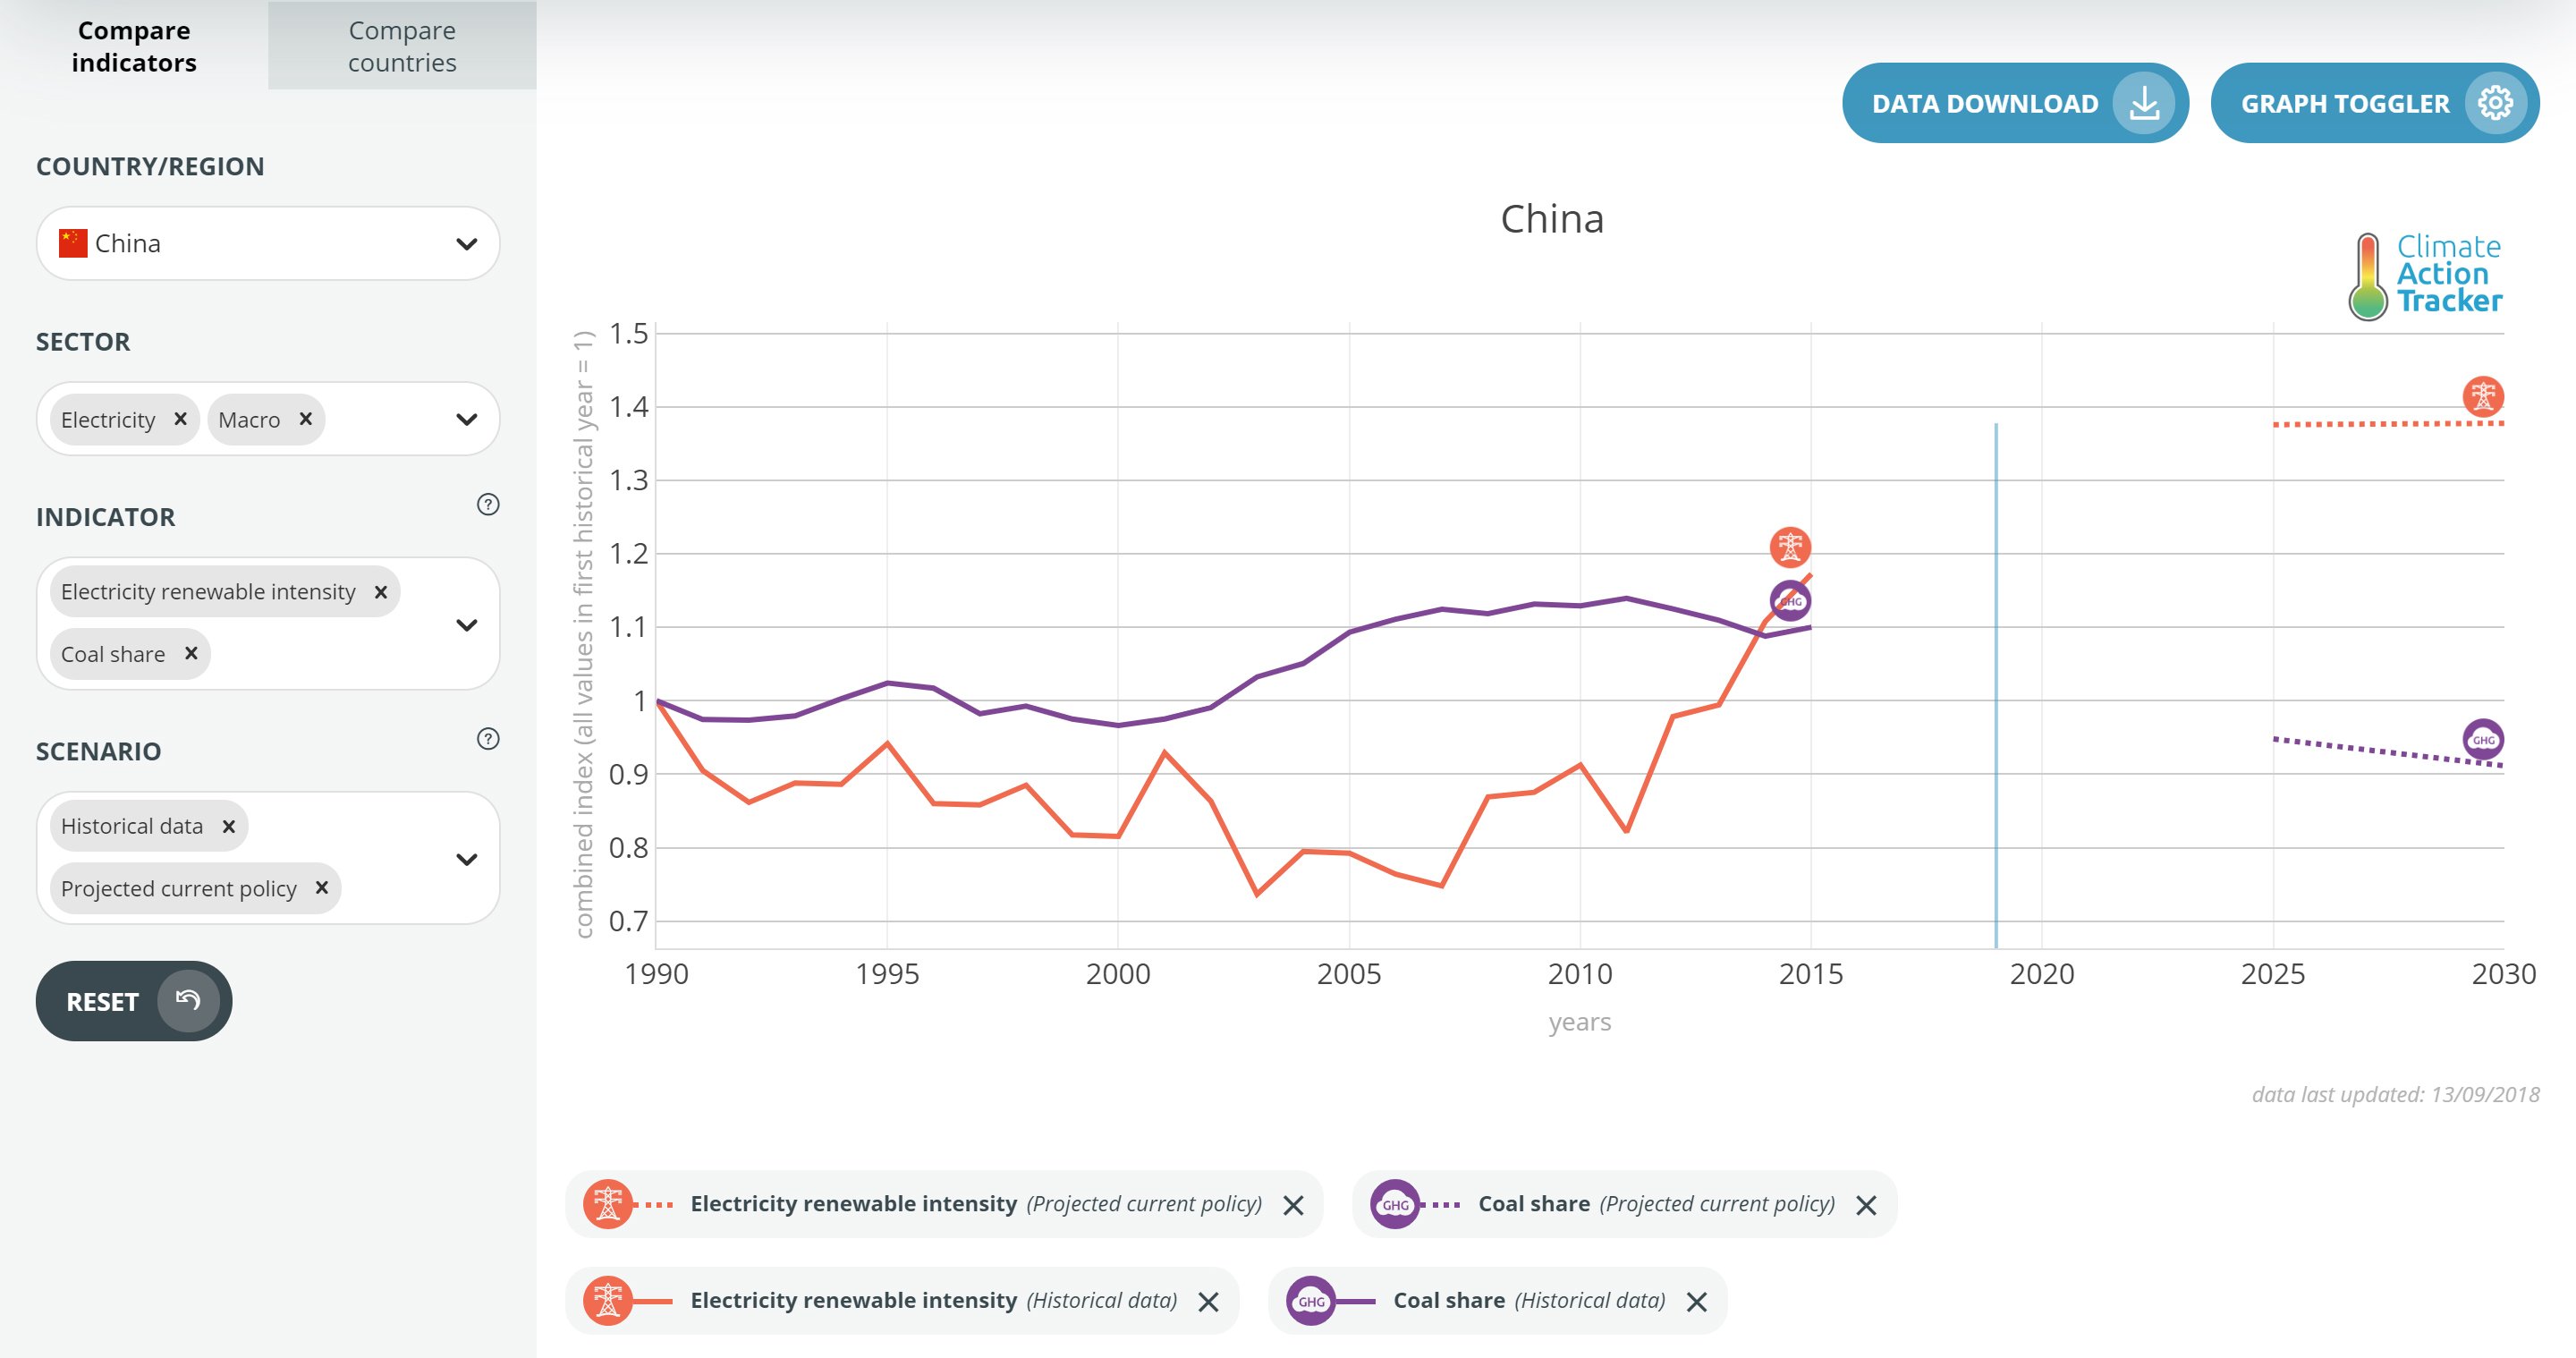
Users can compare indicators within a country to learn, for example, how the growth of renewables in electricity generation compares with the change in overall share of coal in the energy supply.

Available scenarios
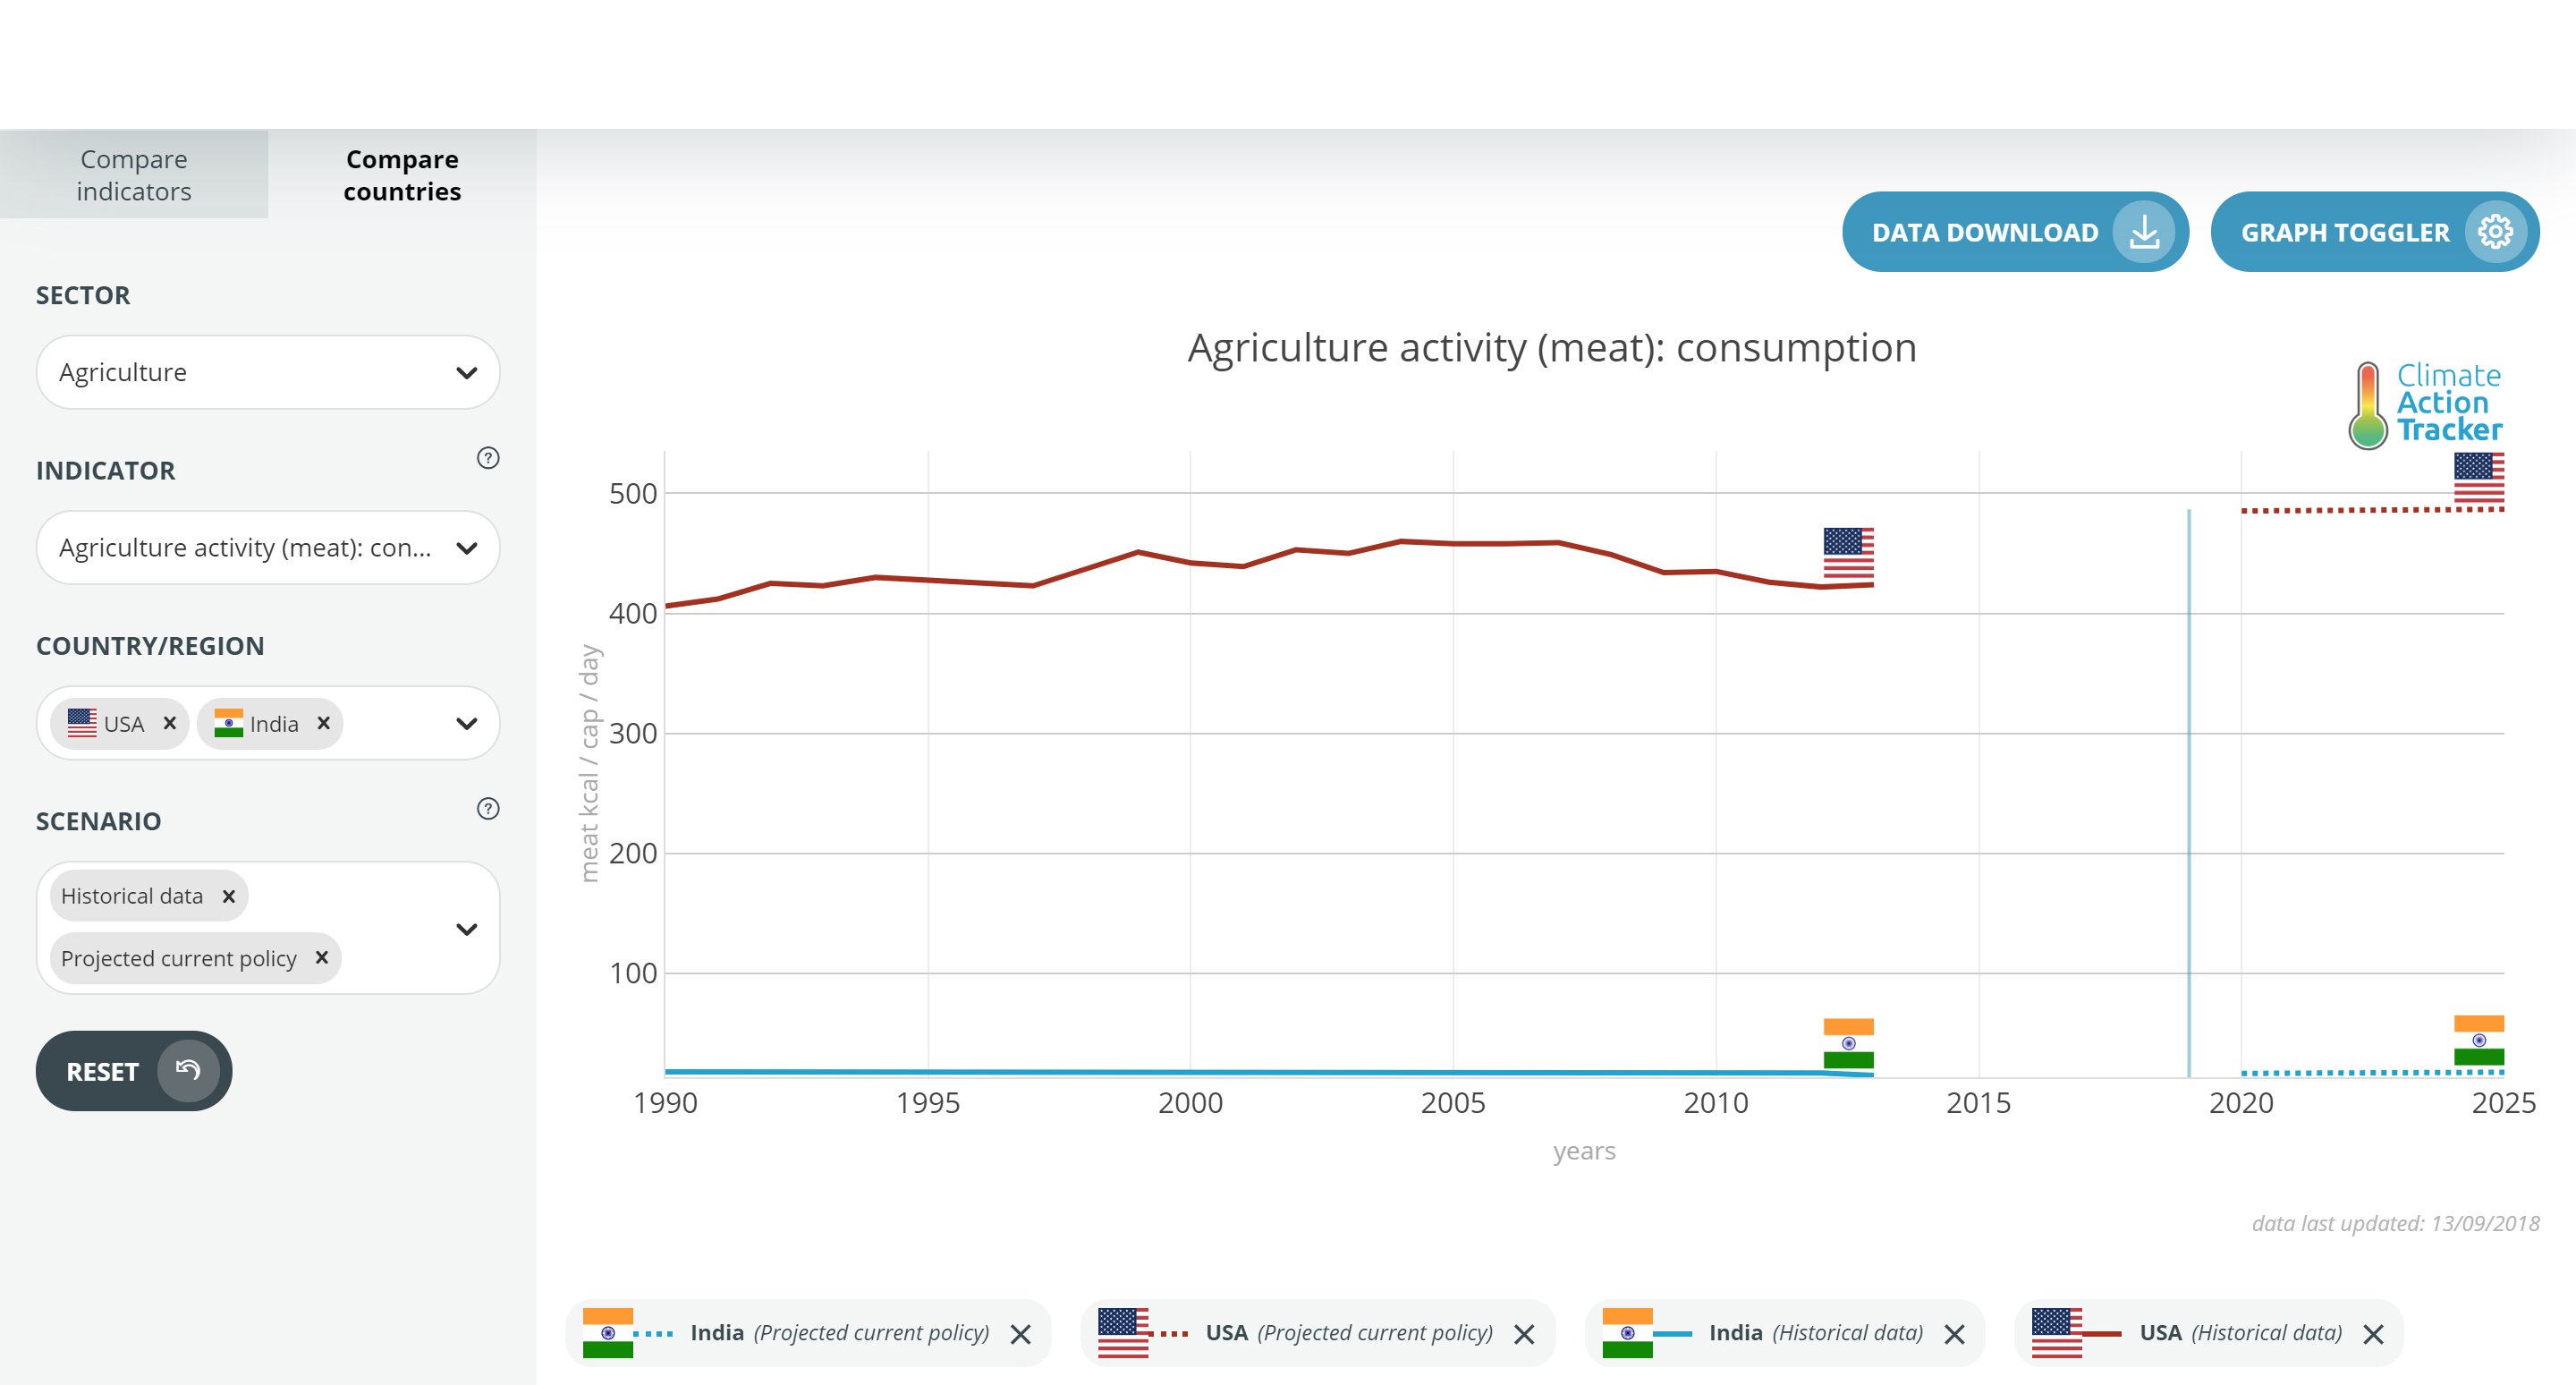
The portal shows not only historical data, but also three future scenarios (for selected indicators) – a current policies scenario (‘Where are we?’), best-in-class benchmarks, and 2°C scenario. Look out for 1.5°C scenarios soon (‘Where do we want to go?’)!
Quick links
Stay informed
Subscribe to our newsletter