
Japan
Assumptions
Historical emissions
Historical emissions data were obtained from the UNFCCC GHG inventory and cover the period from 1990 to 2019 submitted in Common Reporting Format (UNFCCC, 2021). The submission to the UNFCCC is supplemented by the National Inventory Report data file, which provides sector-level emissions after allocation of electricity-related emissions to end-use sectors (GIO & MOEJ, 2021).
2020 pledge
Target emission level for 2020 was calculated from 2005 emissions data from the GHG inventory data submitted to the UNFCCC in 2020 (UNFCCC, 2020). We calculated Japan's LULUCF accounting quantities in 2020 for afforestation, reforestation and deforestation based on the accounting rule under the second commitment period of the Kyoto Protocol. Net removal by forests (38 MtCO2e/year), revegetation (1.2 MtCO2e/year) and agricultural soil sinks (7.7 MtCO2e/year) is taken into account for 2020 (Government of Japan, 2019a).
NDC and other targets
2030 targets, both the first NDC and the new target announced in April 2021, were quantified using the UNFCCC GHG inventory data submitted in 2021 (UNFCCC, 2021).
2050 net zero goal
To estimate the emission levels in 2050 excluding LULUCF, we explored three cases of LULUCF emission sink levels in 2050: (1) linear extrapolation of a 10-year trend (2009-2019) out to 2030, followed by constant sink levels out to 2050, (2) average sink levels for a 10-year period (2009-2019), and (3) expected LULUCF sink credit levels under the first NDC (37 MtCO2e/year). The first case had the lowest sink levels (30 MtCO2e/year), whereas the second case had the largest (61 MtCO2e/year). Therefore, the 2050 emissions excluding LULUCF under the net zero goal are estimated to range between 30 and 61 MtCO2e/year.
Policies and action projections
Energy-related CO2 emissions
For the analysis of current policy projections, we used the IEA World Energy Outlook (WEO) 2019 Current Policies Scenario (CPS)(IEA, 2019), which covers various climate related policies implemented as of 2019 and their impact on energy-related CO2 emissions, as a basis.
The IEA WEO 2019 foresees a relatively large share of electricity generation from nuclear energy in 2030 (17%). While this is overachieved by the current assumptions of the government (2018 Basic Energy Plan), it is not completely supported by the rate of restart of currently shut down nuclear power plants. We explored “low emission” and “high emission” cases with varying shares of renewable and nuclear power generation. For both cases we assumed that the recent announcement on the phasing out of old and inefficient coal-fired power plants would be fully implemented (METI, 2020a, 2020e). Based on our assessment of the announcement, it was estimated that the share of coal in total electricity generation in 2030 would be kept at 26% as targeted under the first NDC. We also assumed that, based on the historical trends up to 2019, the targeted electricity demand for 2030 under the first NDC will be met (METI, 2021a).
In the low emissions case, we assumed that:
- Full nuclear restart (same assumptions as in the December 2019 update): all 25 nuclear reactors (plus two allowed to resume construction) that have applied for restart as of May 2021 will be approved, restart by 2025 and complete their extended 60-year lifetime (with an average 6500 hours/year operation, comparable to about 7000 hours/year assumed for 2030 in IEA WEO 2019 scenarios). For the two reactors under construction, the Ohma reactor is assumed to start operating in 2026 and the Shimane No. 3 reactor in 2021 (Renewable Energy Institute, 2020);
- Coal and oil power shares kept to the NDC target (coal: 26%, oil: 3%);
- Renewable electricity generation reaches 301 TWh/year in 2030 as estimated by Asano and Obane (2020), exceeding the first NDC target;
- Natural gas power fills the remaining gap.
In the high emissions case, we assumed that:
- Limited nuclear restart with low capacity factor (same assumptions as in December 2019 update): only 15 reactors that have been allowed to restart as of May 2021, after additional safety measures were implemented, would be in operation up to 2030 (some with a 60-year extended lifetime) but at a much shorter 3250 hours/year operation on average, taking into account the possible court cases and unplanned inspections.
- Coal power share kept to 26% and oil to 3% as per NDC target;
- Renewable energy share reaches 271 TWh as estimated by METI (2021a), also exceeding the first NDC target;
- Gas power fills the remaining gap.
We also revised the average CO2 emission factor of electricity from coal-fired power plants following the announcement to phase out old and inefficient plants. For 2030, we assume a 5% reduction in average CO2 emission factor per kWh in 2030 compared to 2018 levels as a result of phasing out old and inefficient coal-fired power plants. This estimate is based on the following considerations:
- Ultra-supercritical (USC) and Integrated Gasification Combined Cycle (IGCC) plants account for roughly 40% of total coal power generation today (authors’ estimate for 2017 based on the USC and IGCC capacities presented above, 80% capacity factor and the IEA 2019 World Energy Balances);
- Existing USCs are roughly 10% to 15% more efficient than the non-USC (43%–45% compared to 37%–41%, based on the Japan Coal Plant Tracker database). New USCs under construction or planning are expected to be even more efficient;
- Considering that some non-USCs remain in 2030, the share of coal-fired autogeneration remains constant, and that the IEA WEO Current Policies Scenario on which the CAT projections are based includes power generation from coal-derived products, we estimated that, on average, the CO2 emission factor will improve by about 5%.
After the recalculation of the 2030 electricity mix, CO2 emissions were calculated— CO2 emission factors per technology were assumed to be identical to those in the WEO 2019 CPS. Finally, the growth rates of energy-related CO2 emissions up to 2030, recalculated based on the IEA WEO 2019 CPS, were applied to the 2018 historical energy related CO2 reported in the national GHG inventory report submitted to the UNFCCC.
We do not use “With measures” emissions projection provided in Japan’s Fourth Biennial Report (BR4) as reference. The BR4 “With measures” scenario is an NDC achievement scenario, which takes into account, not only the policy measures already implemented in FY2013, but also those to be implemented by FY2030 (Government of Japan, 2017). The assumed GDP growth rates are also very high—on average 1.7% per year for 2013-2030 based on the government's growth target (METI, 2015).
Other emissions
For the emissions of non-energy CO2, CH4 and N2O, we linearly extrapolated historical trends of two different emission intensity indicators: per unit GDP and per capita, into future years. For both intensity indicators, the historical trends observed between 2009 and 2019 were linearly extrapolated to 2030. The pre-COVID-19 GDP growth projections up to 2030 were taken from IEA (IEA, 2019) and population projections were taken from UN Population Prospects (medium fertility variant) (UN DESA 2019). The 2030 projections using different emission intensity indicators were similar.
For F-gas emissions, the expected impacts of the Act on Rational Use and Proper Management of Fluorocarbons (2013 amendment) to enhance management of F-gas use and the Ozone Layer Protection Act (‘F-gas Act’, 2018 amendment) to regulate the production and imports of F-gases to comply with the Kigali Amendment were also considered. Our calculations show that the HFC emission levels are projected to fall far short of the levels targeted under the NDC (Government of Japan, 2015; MOEJ, 2012; MOEJ & METI, 2014).
As described in the current policy projections section, the F-gas Act has not been successful in improving the recovery rate of refrigerants from end-of-life refrigeration and air conditioning equipment in 2017 was only 38% (METI; MOEJ, 2019). Based on the historical trends reported in METI and MOEJ (METI; MOEJ, 2019), we assume that the HFC recovery rate will not improve over time (40% for 2020-2030). We also assume that the leakage rates for the in-use stock will also not improve under current policies. Regarding the 2018 amendment of the Ozone Layer Protection Act, the business-as-usual consumption levels are projected to be below the Kigali cap at least until 2025 (METI, 2018b); the Kigali cap for Japan becomes significantly lower only in 2029. Since there is some time lag between consumption and emissions, we assume that the amended Ozone Layer Protection Act will not affect the HFC emission levels up to 2030.
The point of departure for the revised F-gas emission projections is the business-as-usual (BAU) projections provided in the background document of the Plan for Global Warming Countermeasures (MOEJ, 2016a) – the Plan projects F-gas emissions to increase from 39 MtCO2e/year in 2013 to 77 MtCO2e/year in 2030 under a BAU scenario. The three measures: (i) enhanced recovery from end-of-life equipment, (ii) avoidance of leakage from in-use equipment, and (iii) switch to lower GWP F-gas and non-F-gas refrigerants are expected to reduce emissions to the NDC target level of 29 MtCO2e/year in 2030. In our assessment, we assume that only part of the NDC implementation plan, i.e. the switch to lower GWP F-gas and non-F-gas refrigerants, would be achieved.
COVID-19 impact
We applied a novel method to estimate the COVID-19 related dip in greenhouse gas emissions in 2020 and its impact until 2030. The uncertainty surrounding the severity and length of the pandemic creates a new level of uncertainty for current and future greenhouse gas emissions. For 2020 emissions we apply a gas-by-gas approach. For direct CO2 emissions, we apply growth rates from Global Carbon Budget (Le Quéré et al., 2020) for 2019-2020. For non-CO2 emissions, we additionally consider a sector split. For non-CO2 emissions, we estimate the emissions intensity (GHG emissions/GDP) from a pre-pandemic scenario and apply the most recent GDP projections (average of estimates by IMF, World Bank, Bank of Japan and OECD).
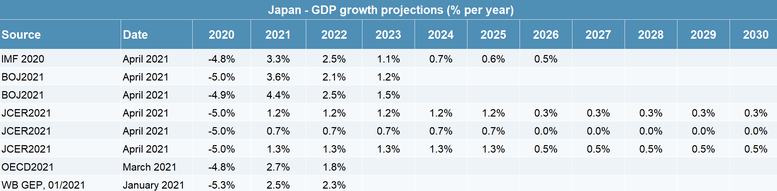
For emissions between 2020 and 2030, we first update the current policy projections using most recent projections, usually prepared before the pandemic. We then distil the emission intensity (GHG emissions/GDP) from this pre-pandemic scenario and apply to it most recent GDP projections that take into account the effect of the pandemic. To capture a wide range, we compiled GDP growth projections from IMF (2020–2026) (IMF, 2021), OECD (two scenarios for 2020–2022)(OECD, 2021), World Bank (2020–2022) (World Bank, 2021), Bank of Japan (2020–2023)(Bank of Japan, 2021), and Japan Center for Economic Research (JCER; 2020–2030) (JCER, 2021). All projections considered in the analysis were published in 2021. For the years following the projection period of the aforementioned forecasts up to 2030, we use the GDP growth rates that were used as a basis for the original pre-pandemic current policy scenario, i.e., projections from the IEA WEO 2019. For 2030, the upper bound GDP projection was based on the IMF forecast and the lower bound projection was based on the JCER’s “Risk scenario”.
Global Warming Potentials
The CAT uses Global Warming Potential (GWP) values from the IPCC's Fourth Assessment Report (AR4) for all its figures and time series. Assessments completed prior to December 2018 (COP24) used GWP values from the Second Assessment Report (SAR).
Further analysis
Latest publications


Stay informed
Subscribe to our newsletter