
USA
Assumptions
Global Warming Potentials
Climate Action Tracker assessments before December 2018 used the global warming potentials (GWPs) from the IPCC’s Second Assessment Report (SAR). At that time, we updated all figures and time series to GWPs from the Fourth Assessment Report (AR4). For the USA, this resulted in higher estimated emissions levels for historical data, pledges, and emissions projections.
Historical emissions
Historical emissions are 2019 inventory emissions developed by the U.S. Environmental Protection Agency (U.S. Environmental Protection Agency, 2019). The last available historical year is 2017.
Pledges
Targets for 2020 and 2025 were calculated from the 2019 national inventory submissions.
For the 2020 pledge, NDC, and long-term target, we apply the indicated reduction to the 2005 inventory data for 2005 including LULUCF, and then subtract the projected emissions for the LULUCF sector. The LULUCF emission projections up to 2030 were taken from the 6th National Communication, which reported sinks of 0.6–0.9 GtCO2e/year in 2025 (U.S. Department of State, 2014). The 2016 CAT update used LULUCF projections from the 2nd Biennial report, which reported a sink of 0.9 to 1.2 GtCO2e/year in the same year (Climate Action Tracker, 2016b; U.S. Department of State, 2016). The methodological changes in the 2nd Biennial Report increased the sink from forest and land use by about 4.3 to 5.1%-points compared to the total emission level in the base year, 2005, rendering the target for the remaining sectors 3.9 to 4.6%-points easier to achieve. The sinks in the 2nd Biennial report were calculated with a different methodology than LULUCF in the CRF historical data for 2005, on which the NDC target is based, making these values incompatible with the historical data. We have therefore returned to using projections from the 6th National Communication, which is consistent with the historical data. The LULUCF projections for 2050 were taken from the Mid-Century Strategy document and represent the full range of modeled sink scenarios in the report (The White House, 2016).
Current policy projections
The current policy projection was done in four steps:
- First, energy-related CO2 emissions projections were taken from EIA’s Annual Energy Outlook 2019 (U.S. Energy Information Administration, 2019). We use two scenarios from the Annual Energy Outlook – the reference scenario and the low economic growth scenario – to create a range of emissions projections. The economic growth assumptions in the reference scenario are lower than those projected by the Congressional Budget office in May 2019 (U.S. Congressional Budget Office, 2019), but are broadly aligned with historical trends.
- Second, industrial process CO2 emissions were projected by applying the historical ratio (2000-2015) of industrial process CO2 emissions to projections of industrial energy related emissions from the Annual Energy Outlook 2019 Reference Case.
- Third, other GHG emission projections were taken from the 2nd Biennial Report, based on the Current Measures scenario, which includes policies that were implemented through mid-2015 (U.S. Department of State, 2016) . We did not consider alternative economic growth scenarios for other GHG emissions.
- Fourth, all the aforementioned emissions were aggregated and then harmonised to historical data by applying the annual percentage change estimated from the projected dataset to the historical inventory data.
As of May 27, 2019, the US had still not submitted its third Biennial Report to the UNFCCC, the deadline for which was the end of 2017. One implication of this failure to report is that it makes it more difficult for domestic and international organisations, like the Climate Action Tracker, to accurately assess future emissions development in the US, particularly for non-energy CO2 and non-CO2 emissions.
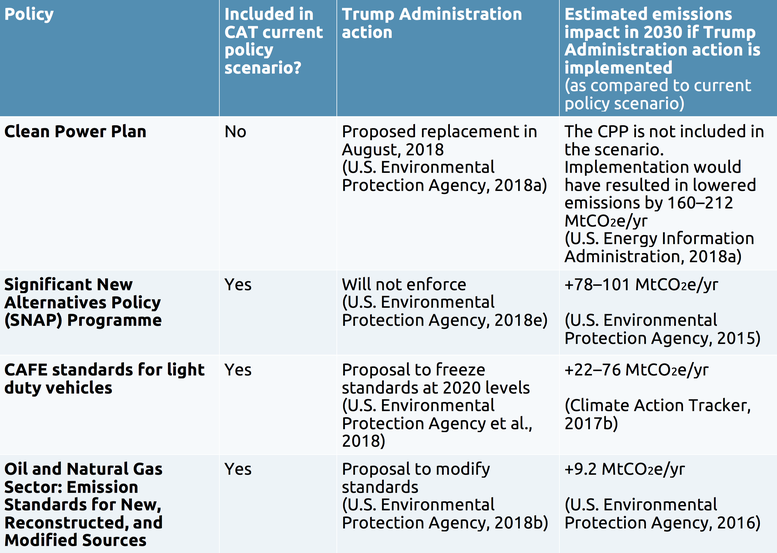
Table: Selected policies under threat from the Trump Administration – how are they included in the CAT current policy scenario
Further analysis
Latest publications


Stay informed
Subscribe to our newsletter