
Chile
Assumptions
Historical emissions
Historical emissions from 1990 to 2013 were taken from Chile’s National Greenhouse Gas Inventory System (SNIChile) (Ministerio del Medio Ambiente del Gobierno de Chile, 2018). These numbers are also included in Chile’s Third National Communication, published in December 2016 (Government of Chile, 2016b). The emissions, which are available gas per gas in Global Warming Potentials (GWPs) from the IPCC Second Assessment Report, were converted to GWPs from the Fourth Assessment report for N2O and CH4. Emissions for SF6, HFCs, and PFCs were not converted to AR4 GWPs but left in SAR GWPs as these conversions are less straight forward than for non-F-gases. Leaving these gases in SAR GWPs does not affect the overall emissions because the share of national emissions of these gases in less than 1%.
Pledges and targets
The 2020 pledge did not state a reference pathway, but specifically states that it will be a reduction from BAU as projected in 2007. We have therefore calculated Chile’s 2020 pledge using as reference the 2007 BAU scenario from Boston Consulting Group (2013). This pathway closely resembles the 2007 BAU presented by (Searle, 2011) on behalf of the Chilean Government in the same context. As the pledge covers emissions including LULUCF, the emissions level resulting from the pledge is first calculated based on BAU emissions including LULUCF. Projected LULUCF emissions (Boston Consulting Group, 2013) are then subtracted to arrive at the pledged emissions level excluding LULUCF, which is shown in the graph. The BAU shown in the graph excludes LULUCF. This BAU scenario is harmonised to historical emissions—up to 2007–in AR4 by adding the estimated difference from historical years between the BAU scenario and the inventory. For future years—2008 and onwards—growth rates from the BAU scenario are applied.
Both targets presented in Chile’s NDC were quantified based on the GDP assumptions from the GHG Mitigation Plan for the Energy Sector (Ministerio de Energía, 2017b), which projects an average 3% growth per year. The current policy projections are based on the same assumptions on GDP growth.
While the GDP projections in the Mitigation and Action Plans and Scenarios (MAPS) scenarios are specifically mentioned in Chile’s NDC submission, we assume that the updated GDP numbers from the Mitigation Plan should be used for quantifying absolute emission levels resulting from the targets. Chile’s NDC intensity targets are very sensitive to the projected GDP growth assumptions. If a slightly higher GDP growth rate is used, the NDC target shifts up (less ambitious, allowing for more emissions) potentially resulting in Chile achieving both its NDC targets with the current policy scenario.
Current policy projections
We estimate total emissions as the sum of the agriculture, waste, energy and Industrial Processes and Product Use (IPPU) sectors. The first two sectors are taken from MAPS Chile (Línea Base 2013, PIB bajo) (Government of Chile, 2014). The base year of the MAPS Chile scenario is 2013, and it is based on macroeconomic projections from 2013 (low case GDP growth, an average annual GDP growth of 3% through 2030) and includes implemented policies up until 2013. The IPPU sector is quantified by assuming a continuation of historical emissions trends from the inventory due to lack of available national projections. The energy sector projections are taken from the Mitigation Plan’s current implemented policies scenario (Ministerio de Energía, 2017b). The policies included in this scenario include the Unconventional Renewable Energy Law (Law 20.257/2008), the carbon tax (Law 20.780/2014), and the results of electricity supply tenders as of December 2017 (Ministerio de Energía, 2017b). Some newer policy developments such as the update on the Distributed Generation Law (also referred to as the “Net Billing” Law) (Law 20.571), which triples the capacity threshold for installed capacity for projects of self-consumption, or the Electromobility Strategy are not quantified due to lack of available data.
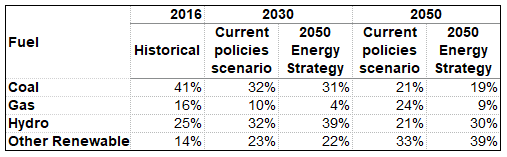
Chile’s Mitigation Plan also includes a scenario developed in the context of Chile’s National Energy Policy towards 2050 (also referred to as the 2050 Energy Strategy), we quantify this as planned policies. Projections on future energy mixes differ in both scenarios. The table below illustrates the fuel mix in the power sector in 2016 according to the International Energy Agency Energy Balances (IEA, 2017) and under different assumptions for projections from the Mitigation Plan (Ministerio de Energía, 2017b).
Shares of different fuels in electricity mix
In comparison to previous versions, the updated assessment for Chile includes the Industrial Processes and Product Use (IPPU) sector, responsible for about 7% of GHG emissions historically in average. This last sector was not quantified in previous analyses based on MAPS because—unlike previously thought—MAPS Chile does not include this sector. The IPPU sector is now included in both current and planned policy scenarios.
Planned policy: National Energy Policy Framework (2050 Energy Strategy)
Additional to the current implemented policies scenario, Chile’s Mitigation Plan includes a scenario which is aligned to the 2050 Energy Strategy. We have added this scenario as a planned policy scenario. This scenario includes the targets of electricity generation from renewable energy of at least 60% by 2035 and 70% by 2050.
Our analysis estimates that by following the planned policies pathway presented on the Mitigation Plan, Chile will achieve its 2020 pledge, its unconditional NDC target and come close to achieving its conditional NDC target.
Global Warming Potentials
Previous assessments of the Climate Action Tracker used the global warming potentials (GWPs) from the IPCC’s Second Assessment Report (SAR). For this assessment we have updated all figures and time series to GWPs from the Fourth Assessment Report (AR4).
Further analysis
Latest publications


Stay informed
Subscribe to our newsletter