
China
Assumptions
Historical emissions
Historical emissions data excl. the LULUCF sector for all GHGs were obtained from the PRIMAP-hist national historical emissions time series and cover the period from 1990 to 2019 (Gütschow, Günther and Pflüger, 2021). This includes CO2 and non-CO2 breakdown by sector: energy, industrial process, agriculture, and waste. For 2020 and 2021 values, we apply a gas-by gas approach. For CO2 emissions, we apply emission growth rates from Global Carbon Project (2021; 2021) from 2019–2020 (+1.7%) and 2020–2021 (+3.7%). For energy and industry non-CO2, we assume emissions growth aligns with growth in GDP, 2.3% in 2020 and 8.1% in 2021, which reflects official government estimates as well as international economic organisations such as the IMF. For Agriculture and Waste non-CO2 emissions, we extrapolate the last 5-year average from historical emissions.
Historical emissions data for the LULUCF sector are based on the Chinese inventory as submitted to the UNFCCC for the years 1994, 2005, 2010, 2012 and 2014 and is not extrapolated onwards due to uncertainties (Government of China, 2018).
As of September 2018, the CAT uses 100-year Global Warming Potentials (GWPs) from the IPCC Fourth Assessment Report (AR4).
NDC and other targets
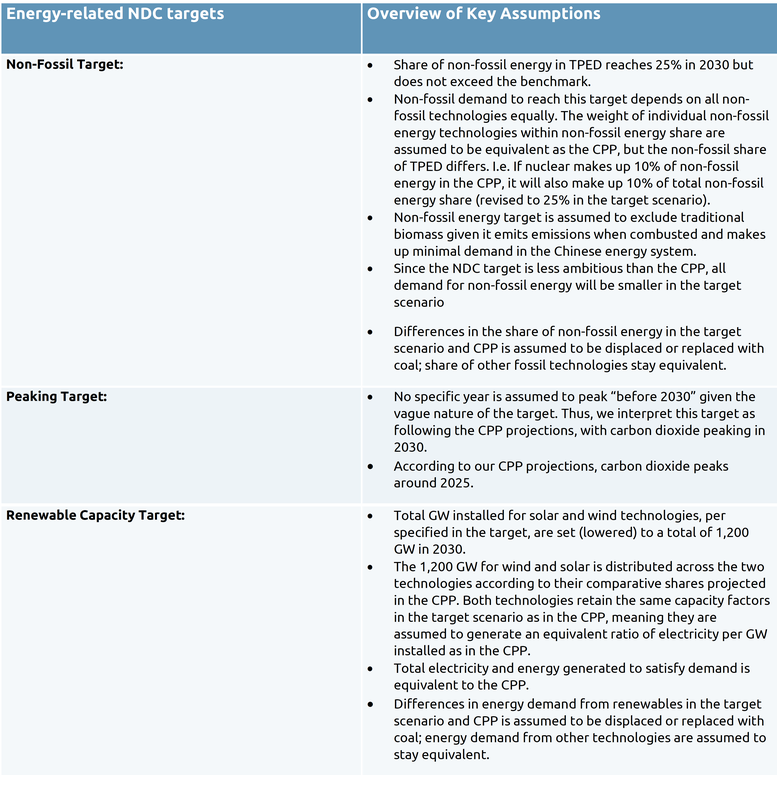
For China’s updated NDC targets, we quantify the non-fossil target, the peaking target, the carbon intensity target, and renewable energy capacity target separately. For the quantification of all targets, we also incorporate achievement of the demand-side policies in China’s current policies pathway (CPP). China’s rating is based on the upper and lower end of the peaking target in 2030, which are equivalent to the emissions trajectory under China’s current policies, as emissions expected are lower than other energy-related targets. In other words, this is the most binding target out of all NDC targets (previously, achievement of the peaking target and the non-fossil share target were the most binding). After quantifying all targets separately, we exclude the non-fossil share, renewable capacity installation and carbon intensity targets from the NDC range, as this will be overachieved by the peaking target.
The elements of China’s targets that we quantify apply to CO2 only (excl. LULUCF), given the scope of the targets. To calculate total GHG emissions (excl. LULUCF), we add non-CO2 emissions based on our current policies projections as described below.
Non-Fossil Target:
China’s NDC non-fossil target has been increased to 25% in 2030 from 20%, while China’s 14th FYP includes the now intermediary target of 20% by 2025. In our CPP, China is projected to overachieve this target comfortably.
To calculate energy-related CO2 emissions based on the 2030 target, we:
- Recalculate the total primary energy demand (TPED) from IEA WEO (2021d) Stated Policies Scenario (STEPS)—which for China we take as a basis for the current policies scenario due to the fact that stated policies are highly certain to be achieved—based on the Chinese methodology of applying the average efficiency of coal-fired power plants to calculate TPED from non-fossil sources (renewables and nuclear). We assume an efficiency of 310 grams coal equivalent (gce) per kWh (equals 9.08 MJ/kWh for Chinese coal-fired power plants), based on China’s target for 2020 from the 13th Five Year Plan, which improves over time to 300 gce/kWh in 2025 and 295 gce/kWh in 2030 based on a conservative scenario from IEA (2021c).
- TPED in this target quantification is aligned with TPED from the CPP (see section below). Technology shares for target achievement mirror those in the CPP, aside from non-fossil sources that are set to achieve the 25% share target (no more, no less), and coal, which is assumed to replace or be displaced by the growth of non-fossil sources.
- Individual non-fossil energy sources are adjusted equally based on their relative share of non-fossil energy demand in the CPP.
- Emissions in the target achievement are calculated based on emissions factors from WEO 2021 (STEPS) in the CPP.
- Assume any additional action beyond current policies needed to reach this target will be accomplished by prioritising energy supply from solar and wind technologies at the expense of coal.
Peaking Target:
Since the NDC contains the target of peaking CO2 emissions before 2030, the implications for what an “NDC scenario” constitutes can be interpreted in a variety of ways—for instance, the least ambitious way would be to assume emissions simply peak by 2030 while a more ambitious interpretation would be to assume that this peaking happens earlier at an arbitrary date. According to our current policy projections, China’s emissions are due to peak around 2025. Thus, the quantification of the peaking target is equivalent to our current policies scenario, which peaks around 2025 (before 2030). As emissions expected under the peaking target is lower than those quantified for other NDC targets, the upper and lower bound of CO2 emissions of this target represent our NDC range.
Renewable Capacity Target:
The NDC’s 1,200 GW of renewables installed by 2030 target refers to solar and wind technologies. In our CPP, China is projected to overachieve this target comfortably for both technologies. To quantify emission levels under this target, solar and wind capacity is revised downward to 1,200 GW in total according to their respective ratio expected in 2030. Under this target achievement, we only expect approximately 480 GW of wind power and 720 GW of solar PV installed in China. Like the quantification of the non-fossil share target, other elements are assumed to be the same as the CPP. For example, other supply technologies are expected to supply the same amount of power. Overall primary energy demand in the country is also assumed to be the same as the CPP. We assume that the difference in energy supplied (less wind and solar) is supplied by coal. Given that coal capacity is not replaced by wind and solar one-for-one, overall power capacity in China’s energy system decreases with the achievement of this target.
Carbon Intensity Targets:
For the calculation of the intensity targets for 2020 and 2030, we use historical emissions data from China’s most recent inventory submission to the UNFCCC, historical GDP data from China’s most recent Statistical Yearbook and GDP projections from our current policies scenario (National Bureau of Statistics of China, 2018). For historical years after 2018, we deviate from official Chinese data due to annual inconsistencies; we now apply latest official growth rates from the Chinese government (rather than absolute numbers), validated by international organisations such as the World Bank and IMF, to establish data for latest historical year. GDP projections until 2030 are based off forecasts from various sources and described in “COVID-19” section below. We assume that the carbon intensity target applies to all CO2 emissions excluding LULUCF. The emissions quantification for carbon intensity targets changes annually, due to updated forecasts in China’s GDP trajectory from COVID-19 and otherwise.
Current policy projections
Energy-related CO2 emissions:
We create two scenarios for energy-related CO2 emissions, a minimum and a maximum scenario.
For the high emissions scenario (higher bound), we start with the IEA WEO (2021d) STEPS, which exceeds China’s 15% non-fossil energy share target for 2020 (Central Committee of the Communist Party of China, 2016), 14th FYP targets to peak coal consumption (NDRC, 2022) and have 20% non-fossil share targets in 2025 (People’s Government of Fujian Province, 2021), and a 50% non-fossil share in electricity generation target by 2030 (Asia Pacific Energy, no date). However, the scenario does not achieve several prominent targets:
- 39% non-fossil share in electricity generation for 2025 from the 14th FYP on energy (37.7%) (NDRC and NEA, 2022)
- 15% gas in primary energy supply in 2030 (missed by 7%) (Asia Pacific Energy, no date)
- 50% renewable energy capacity by 2025 (missed by 9%) (SASAC, 2021)
The high emissions scenario is adjusted to meet all the above targets, while TPED projections for 2025 are revised upwards to 5.92 bntce (from 5.65 in our scenario) in line with calculations made by Chinese researchers assessing the 14th FYP on energy (NDRC and NEA, 2022). Previous renewable electricity generation targets are removed as they are assumed to be superseded by the 14th FYP on energy. Further, the gas share target noted above is revised down from 15% to 12% to align with China National Petroleum Corporation forecasts, given the aggressive displacement of coal is implausible in the wake of national energy security focus and growing coal consumption projections (Chow and Singh, 2021). Gas is assumed to replace coal 1:1, as coal-to-gas switching is seen to be primarily driven by industry and buildings sectors, rather than in the power sector (Cornot-Gandolphe, 2019). While many targets have updates forthcoming or already in drafting stage, we only adjust for policies already announced or implemented.
Under this scenario, energy-related CO2 emissions continue to increase, reaching 10.3 GtCO2 in 2025 and 9.7 GtCO2 in 2030. For CO2 emissions from fuel combustion, values in the IEA WEO 2021 STEPS were adjusted using the primary energy factors for renewable energy and nuclear power used in the Chinese accounting (different from IEA accounting).
For the lower bound of the scenario, we adjust electricity capacity and generation outlook for renewables to the Stated Policies Scenario (SPS) from the China Renewable Energy Outlook 2020 (CREO) (ERI and NDRC, 2021). We take the decision to include results from the SPS from CREO as the ambitious end of the current policies projections since China has a history of achieving the targets and policies it announces, as well as its centralised governance and planning structure. As in the higher bound, we adjust the primary energy demand to meet current policies, although the CREO already meets all targets aside from the gas and 50% non-fossil share of electricity targets in 2030. Thus, the scenario is adjusted to meet these targets only. Coal consumption begins to decrease before 2025 in both ranges of current policy scenarios.
Under this ambitious scenario, energy-related CO2 emissions plateau and decline in the short-term, reaching 9.8 GtCO2 in 2025 and 9.2 GtCO2 in 2030.
For both scenarios, supply-side targets such as production capacity of fossil fuels and installed capacity targets from the 14th FYP on energy are not quantified as these policies likely will result in excess capacity with uncertain outcomes for emissions. The 6 bntce energy consumption cap from the Energy Supply and Consumption Revolution Strategy (2016–2030) is also not quantified due to significant energy demand growth trends.
Industrial-process emissions:
We project industrial-process CO2 emissions by applying growth rates from cement process emissions for the non-OECD region based on the IEA Energy Technology Perspectives 2016 report’s 6DS scenario to our latest 2021 value estimates. CO2 emissions for industry peak after 2025 given the trends and commitments from China’s aluminium, steel, and cement sectors.
Other non-CO2 emissions:
For non-CO2 emissions from energy, fugitive emissions, agriculture, industrial processes, and waste, we apply sector-specific growth rates for non-CO2 emissions from (Lin et al., 2019) to our latest 2021 value estimates. This source considers recent policies implemented since 2015, leading to improved certainty on Chinese non-CO2 emissions in 2030, compared to previous assessments. The reference scenario used assumes that no non-CO2 mitigation measures will be implemented before 2050, except for efforts made to reach the Montreal Protocol targets for HFCs from HCFC-22 production, which are phased out. We additionally quantify the impacts of the Kigali Amendment on HFCs following the staged phaseout schedule eventually leading to an 80% reduction from baseline levels by 2045.
COVID-19 impact
We applied a novel method to estimate the COVID-19 related changes in greenhouse gas emissions in 2020 and its impact until 2030. The uncertainty surrounding the severity and length of the pandemic creates a new level of uncertainty for current and future greenhouse gas emissions.
For emissions between 2020 and 2030, we first update the current policy projections using most recent projections, usually prepared before the pandemic. We then distil the emission intensity (GHG emissions/GDP) from this pre-pandemic scenario and apply to it most recent GDP projections that consider the effect of the pandemic. To capture a wide range, we usually use more than one GDP projection. For China, we have updated the following projections for 2020 and 2021 we now use the confirmed GDP growth statistics, while for 2022 we use China’s national GDP target of 5.5% (He, 2022), IMF’s (2022) 4.8 %, OECD (2021) and World Bank’s (2022) 5.1%, IEA’s (2021d) 5.15%, and Goldman Sachs (Cheng, 2022)(2021) 4.3% projections. Most sources provide GDP projections to 2023, while some go until 2026 (IMF); we then use the GDP growth rate that was used as a basis for the original pre-pandemic current policy scenario (WEO) until 2030.
Global Warming Potentials
The CAT uses Global Warming Potential (GWP) values from the IPCC's Fourth Assessment Report (AR4) for all its figures and time series. Assessments completed before December 2018 (COP24) used GWP values from the Second Assessment Report (SAR).
Further analysis
Latest publications


Stay informed
Subscribe to our newsletter