
USA
Current Policy Projections
Economy-wide
Future developments are subject to large uncertainty because of the severity of the COVID-19 pandemic’s impact on society and the economy, and the ongoing efforts to stop the spread of the virus. As a result, the uncertainty range of emissions projections is significantly larger than in our previous updates. US emissions are expected to decline substantially in 2020 as a result of the lockdown measures imposed, and economic damage caused by COVID-19. Emissions will rebound in subsequent years as the economy recovers. The CAT estimates that emissions will reach between 5.7 and 6.1 GtCO2e/year by 2025 (excl. LULUCF), and will maintain the same levels until 2030. Emissions, after taking into account the effect of COVID-19, will be 3%–7% lower by 2025 compared to emission trajectories without considering the effect of the pandemic.
The US has initiated the process to withdraw from the Paris Agreement and, after November 4 2020, will no longer be bound by its NDC. As a result of the pandemic, the CAT estimates that under current policies, the USA may have been able to reach the lower bound of its (already weak) 2025 NDC, i.e. 26% reduction target. The US is very likely to achieve its 2020 targets, as post-COVID-19 current policies are projected to result in emissions of about 20%–21% below 2005 levels in 2020 (excl. LULUCF) and its 2020 target is 14%–18% below 2005 levels (excl. LULUCF).
On 27 March President Trump signed into law a USD 2 trillion recovery stimulus in loans and grants aimed at helping workers and businesses, called Coronavirus Aid, Relief, and Economic Security Act — also known as the CARES Act (U.S. Congress, 2020).
These recovery measures do not include any direct support to clean energy development. Unlike the CARES Act, the Obama Administration’s recovery stimulus after the 2008–2009 crisis delivered a USD 90 billion injection into renewable energy and energy efficiency, which is credited with driving the rapid expansion in the sector more than a decade ago (The White House, 2016a).
The Democratic presidential candidate, Joe Biden, unveiled in July 2020 a USD 2 trillion economic recovery plan focused on clean energy investments and the creation of green jobs as a vehicle to pull the country out of the economic crisis caused by the pandemic. The ambitious plan aims to escalate climate action in major GHG emitting sectors while addressing climate justice. It outlines concrete targets, including achieving an emissions-free power sector by 2035, upgrading four million buildings over four years to meet the highest energy efficiency standards, stimulating the supply chain of efficient-appliance manufacturing, ramping-up carbon-free mobility and drive innovation and cost reduction in critical clean energy technologies including battery storage and green hydrogen. The plan also calls for the creation of an office of environmental and climate justice at the Justice Department (Biden, 2020).
A 2019 Democrat proposal for a “Green New Deal” (GND) called for economy‑wide action to reach net‑zero GHG emissions, including measures in all major emitting sectors including targets to meet 100% of power demand through zero-emission energy sources, increase energy efficiency in buildings, grow clean manufacturing, overhaul transportation systems (Ocasio-Cortez & Markey, 2019). The Green New Deal also calls for the creation of millions of jobs and to provide long-lasting job guarantee around a decarbonised economy. Some of the measures proposed in the Green New Deal could serve as inspiration to be included in future stimulus packages. Proposals to set up a committee to start to look at the package were rejected by the Senate.
Non-state actors have also urged the need for green stimulus packages for the US. An open letter (“A Green Stimulus to Rebuild Our Economy”) from a group of climate and social policy experts in academia and civil society (Green Stimulus Proposal, 2020) proposed a recovery package to create millions of green jobs and accelerate a just transition out fossil fuels. The Bluegreen Alliance urged the US Congress to pass a robust set of stimulus packages that met principles and standards including forward-looking planning and investments to meet environmental standards, investment in strategic low-carbon solutions, to renew and expand clean energy and tax credits, and establish a new loan fund and grant programme for climate-resilient infrastructure (BlueGreen Alliance, 2020). At the state level, New York passed new legislation that makes renewable energy an integral part of New York state’s post-COVID-19 economic recovery (PV Magazine, 2020).
Compared to CAT projections in December 2019, US emissions projections decreased by 5%–10% in 2030. The main drivers of this decrease are:
- The measures taken to contain the COVID-19 pandemic, which are expected to have a significant impact on the supply of and demand for energy, and consequently the emissions associated with them. The U.S. EIA forecasts that U.S. energy-related CO2 emissions will decrease by 12.2% in 2020 compared to 2019 (U.S. Energy Information Administration, 2020f).
- Lower emissions projections in the electricity sector. The EIA’s Annual Energy Outlook 2020, which does not take into account the effect of the COVID-19 pandemic, projects 20% lower emissions from electricity generation in 2030 compared to the 2019 outlook (reference case), despite increased generation overall, with increased electricity generation from renewables, and decreased generation from coal and gas (U.S. Energy Information Administration, 2020a). Coal is projected to account for 17% of generation in 2030 (down from the 22% projected in 2019), gas for 35% (down from 38% projected in 2019), and renewables for 32% of electricity generation (up from to 24% projected in 2019), with nuclear making up the rest.
While emissions are lower overall, the extent of the decrease has been tempered by the Trump Administration’s continued climate policy rollbacks, namely:
- Higher emissions in the transport sector between 2020–2030 due to the weaker fuel efficiency standards (SAFE). The rule requires automakers a weak 1.5% year-to-year fuel efficiency increase from model year 2021 to 2026, compared to the 5% annual increased required by the Obama-era standards. This, however, is under legal challenge.
- Higher emissions in the transport sector due to a rule that revokes states’ ability to set stricter emissions vehicle standards than the federal ones. This rule limit states’ efforts to decarbonise the transport sector by implementing stricter programmes like Zero Emission Vehicle (ZEV) programmes.
Other rollbacks that had already been quantified in previous CAT projections include the replacement of the Clean Power Plan (U.S. Environmental Protection Agency, 2019e), the non-enforcement of measures to reduce HFC emissions (U.S. Environmental Protection Agency, 2018c) and the repeal of energy efficiency requirements for lightbulbs (U.S. Department of Energy, 2019).
Some recent rollbacks have not quantified in the CAT. These are:
- Revised energy efficiency appliances standards (U.S. Department of Energy, 2020) – not quantifiable because it does not affect existing standards but it makes it more difficult to make stricter efficiency standards in the future.
- Weakened regulations on the release of mercury from oil and coal-fired power plants (The New York Times, 2020a) – the impacts related to GHG emissions are not quantified because while this rule would make it easier and cheaper to operate coal-fired power plants, it is not enough to change the trend of more competitive gas and renewables in the sector.
- Weakened methane emissions standards for oil and gas facilities (U.S. Environmental Protection Agency, 2018a) – the incorporation of this rollback would result in emissions higher than our post‑COVID‑19 current policy projections suggest.
Conversely, increased state and local action, in addition to market pressures, may contribute to additional reductions. A pre-COVID-19 analysis of recorded and quantified commitments from sub-national and non-state actors in the US suggests that if these commitments were fully implemented they could lead to substantial reductions (America’s Pledge, 2019). If subnational efforts are joined by strong federal climate policy over the next decade, the US could reduce emissions 49% by 2030. These commitments are not included in the CAT current policy scenario unless they are supported by implemented policies (see table below).
Energy supply
Electricity supply contributed to 27% of the total 2018 US GHG emissions (U.S. Environmental Protection Agency, 2020b). Total annual emissions in the power sector have declined steadily since 2010. In 2017, the sector dropped from being the largest source of GHG emissions to second-largest, after transport. The decline is mainly driven by a shift in generation to lower and non-emitting sources of generation, such as natural gas and renewables (see below).
COVID-19 & Economic Recovery
The strong link between economic activity and global carbon dioxide emissions, due to the dominance of fossil fuel sources of energy will likely lead to a slowdown of carbon dioxide emissions due to reduced energy consumption. After decreasing by 2.8% in 2019, EIA forecasts that U.S. energy-related carbon dioxide (CO2) emissions will decrease by 12.2% in 2020 (U.S. Energy Information Administration, 2020f).
The lockdown and changes in lifestyles have also had an impact on the supply and demand of electricity, altering the participation of renewables and coal in the sector. As consequence of the economic slowdown and its impact on electricity consumption, the EIA expects that electricity consumption in the US will decline by 4.3% in 2020.
However, the reduction in total power generation is not evenly distributed among energy sources. Given that, at every moment, electricity is generated with the cheapest resources available (i.e. economic dispatch), most of the decline in electricity supply is expected to come from reduced fossil fuel generation, especially coal-fired power plants that are more expensive to generate electricity. The EIA estimates that coal generation will fall by 31% and power generation from natural gas will increase by 3% in 2020 compared 2019 levels (U.S. Energy Information Administration, 2020f).
Because existing wind turbines and solar panels cost little to operate, and don’t require fuel, they are the first sources to be dispatched when they are available. Around 36 GW of additional wind and solar capacity is expected to come onto the grid in 2020, increasing renewable generation by 10% compared to 2019 (increasing the share of renewables to 20% in 2020, compared to 17% in 2019).
Although electricity generation from renewable sources will continue to grow, and renewable energy will continue to be the fastest-growing source of electricity in 2020 (U.S. Energy Information Administration, 2020f), the effects of the economic recession related to COVID-19 are likely to affect the installation of new generating capacity and diminish the investment appetite in renewable technologies, which may decline during this and subsequent years.
The USD 2 trillion stimulus package cut out any direct support to clean energy development, including investments in green infrastructure and the proposed extension of incentives to renewable energy projects in the form of tax credits (Bloomberg, 2020; Vice, 2020). Before COVID-19, the incentives to wind power in the form of a production tax credit (PTC) that was scheduled to completely phase out by the end of 2019, was extended through the end of 2020 (Wind Power Engineering and Development, 2019). This extension gave wind developers an extra year to begin projects in order to receive at least 40% of the original tax credit.
However, the restriction measures taken during the coronavirus crisis are impeding the start of wind project operations.
The initial intention to include USD 3 billion in the CARES Act recovery stimulus for the purchase of oil to increase the country’s petroleum reserves and strengthen the oil industry was not included in the final version because the Democrats opposed it. However, the final stimulus included a bond bailout worth USD 750 billion to be directed across sectors impacted by the crisis (U.S. Congress, 2020). At least 90 fossil fuel companies can benefit from this scheme, including ten out of the top 40 fracking companies (The Guardian, 2020b).
Policy Rollbacks
The Trump administration, through the U.S. Environmental Protection Agency (EPA), has suspended the enforcement of environmental rules in response to the pandemic (U.S. Environmental Protection Agency, 2020a). Under this policy, the EPA has relaxed the obligation of factories, power plants and other facilities to comply with air and water pollution monitoring and reporting of emissions, which, in practice, is an open license to pollute. The agency will not pursue penalties for breaking these rules. Even though the relaxation of the rule was done with the excuse of facing the pandemic, no end date has been set for the end of this non‑enforcement.
In September 2019, the EPA replaced the Clean Power Plan (CPP) with a weaker plan called the Affordable Clean Energy (ACE) (U.S. Environmental Protection Agency, 2019e). The CPP aimed to reduce emissions from the power sector by 32% below 2005 levels by 2030, by setting targets for each state individually. The rule was finalised in July 2019, and by the time it came into effect on 9 September 2019, it was already under at least two legal challenges: one by a group of 23 State Attorneys General and six large cities (NYU School of Law, 2019), and one by a group of major power utilities (Reuters, 2019b).
Even though the government has replaced the CPP, the US power sector still looks set to overachieve the CPP’s emission reduction goals, as market forces alone are expected to reduce emissions by 46% below 2005 levels by 2030 as dirtier coal is replaced with cheaper renewables and gas (U.S. Energy Information Administration, 2020a).
The ACE limits the scope of the plan to reduce emissions inside the fence at individual power plants, for example through efficiency measures or carbon capture and storage technologies, and gives states the ability to set their own rules, a significant departure from the CPP, which would have required entire states to meet set emissions standards. The implementation of the ACE rule would not result in noticeable changes in terms of renewable penetration, fossil fuel consumption and emissions; which evidences the lack of ambition and effectiveness of the plan (U.S. Energy Information Administration, 2020a). This highlights the lack of ambition in the CPP targets and the fact that the Trump Administration has not managed to reverse the uptake of renewables and the declining participation of coal.
Share of renewable electricity generation
In May 2020 , the government weakened regulations on mercury pollution from oil and coal-fired power plants , which makes it easier and cheaper for the plants to operate, reviving an industry that is gradually losing presence in the power sector due to market forces (U.S. Environmental Protection Agency, 2020c).
Similarly, the Trump administration revised a permitting programme designed to safeguard communities from increases in pollution from new power plants, which makes it easier for facilities to avoid emissions regulations (Harvard Environmental Law School, 2020). Even though these rules will have little impact on emissions from power plants that are being pushed out by market forces, they are likely to constrain future efforts to reverse these changes to regulate air pollution.
The government has also proposed weakening emissions standards for new coal-fired power plants from the 2015 standard of 635 gCO2/kWh to between 860 and 1000 gCO2/kWh depending on the type of plant (U.S. Environmental Protection Agency, 2018b). As of May 2020, EPA was in the process of issuing a final rule on the matter (U.S. Office of Information and Regulatory Affairs, 2019).
The emissions intensity of total electricity generation in the US has decreased over the past 15 years, from a high point of 636 gCO2/kWh in 2001 to 455 gCO2/kWh in 2015.
Electricity emissions intensity
In the past, the EPA and the Bureau of Land Management (BLM) have set a series of standards to reduce methane and volatile organic compounds emissions from oil and gas production (U.S. Environmental Protection Agency, 2016). However, in 2018, the EPA proposed changing emissions standards for new, reconstructed, and modified sources in the oil and natural gas sector, which would effectively allow methane leaks to continue for longer before they are found and fixed (U.S. Environmental Protection Agency, 2019d). If the rule were to be rescinded, emissions could rise 9.2 MtCO2e/yr above the CAT current policy scenario in 2030. On July 15 2020, a federal judge in California blocked the rollback and restored the Obama-era rule from 2016 (Reuters, 2020).
The BLM has also reinstated pre-2016 regulations, replacing more recent regulations that were designed to limit methane waste from oil and gas production on public lands (U.S. Bureau of Land Management, 2018).
Continuing with the series of actions that weaken climate policy, the Trump Administration made significant cuts to the borders of two national monuments in Utah (The Guardian, 2020a), and established its final plan to open Alaska’s National Wildlife Refuge (ANWR) (U.S. Department of the Interior, 2019), making millions of acres of public lands available to oil and gas drilling. However, the Trump Administration has still not sold any drilling leases for the area, as legal challenges continue.
The government also proposed weakening the Endangered Species Act (U.S. Fish and Wildlife Service, 2019), which would allow reducing the amount of habitat set aside for wildlife, favour economic assessments when deciding which species to protect, and remove tools that officials use to predict future harm to species as a result of climate change. This limits how regulators assess the impacts of the climate crisis and will make it easier to expand oil and gas drilling. However, a coalition of 17 State Attorneys General are pushing back against the rollbacks with legal challenges (The Washington Post, 2019).
Recent developments in the sector
On a global level, Paris Agreement compatibility requires a completely decarbonised electricity sector by 2050 (Climate Action Tracker, 2016a). Recent developments driving the evolution of the power sector (U.S. Energy Information Administration, 2020e, 2020b):
- Electricity generation from solar PV was up 13% in the US in 2019 from 2018 levels. Before the pandemic, the EIA expected 13.5 GW of solar capacity to come online in 2020, surpassing the previous annual record addition of 8 GW in 2016.
- Electricity generation onshore wind was up 10% from in 2019 from 2018 levels, for the first time becoming the first renewable electricity source. Wind capacity additions totalled 10 gigawatts in 2019, the second-largest year for wind capacity additions (after 2012).
- Coal plant retirements doubled in 2018 (more than 13 GW capacity) compared to 2017. Between 2010 and the first quarter of 2019, more than 546 coal-fired power units announced their retirement, totaling about 102 gigawatts (GW) of generating capacity. Cheaper renewables and gas in recent years have put coal-fired power producers under economic pressure, with eight of them filing bankruptcy in 2019 (Krauss, 2019). As of April 2020, seven coal-fired power plants have been retired, totaling about 2.8 GW of capacity. Over the course of 2020, an additional 3 GW of coal-fired capacity is expected to be retired. The EIA forecasts a rebound in coal production in 2021as natural gas prices rise and make coal more competitive in the power sector.
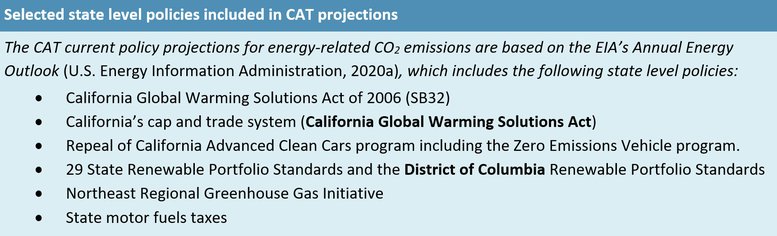
- At the subnational level, 29 states and district of Columbia have mandatory renewable portfolio standards, and nine have voluntary renewable energy targets (U.S. Energy Information Administration, 2019b).
- Five US cities have already achieved their goals of 100% renewable energy (America’s Pledge, 2017). By 2019, 13 states and the District of Columbia had enacted 100% clean electricity goals into legislation, accounting for 16% of the U.S. electricity demand (America’s Pledge, 2019).
In 2018, the US became the world’s largest producer of crude oil (U.S. Energy Information Administration, 2018a); it is already the largest producer of natural gas (U.S. Energy Information Administration, 2018b). US LNG exports grew by 68% in 2019 as a result of several new liquefaction units (U.S. Energy Information Administration, 2020c). The steady upward trend continued during the first quarter of 2020, but exports are expected to decline through the year because of the expected lower global demand for natural gas (U.S. Energy Information Administration, 2020f). With this significant increase, in 2019 the US became the world’s third-largest LNG exporter, behind Australia and Qatar (U.S. Energy Information Administration, 2019c). In 2019, crude oil production and exports grew 11% and 48%, respectively, from 2018 (U.S. Energy Information Administration, 2020d).
Although natural gas is often seen as a ‘cleaner’ source of energy, extracting, transporting and burning it in demand sectors still emits GHG. To achieve the Paris Agreement’s long-term temperature goal, the power sector needs to rapidly transition to being carbon-free by around 2050. This requirement for a complete CO2 emissions phase-out results in a dwindling role for natural gas in the power sector towards the middle of the century (Climate Action Tracker, 2017).
Transport
In 2018, GHG emissions from the transport sector accounted for about 28% of total emissions in the US, becoming the largest contributor in GHG emissions since 1990 for the second year in a row (U.S. Environmental Protection Agency, 2020b). This is explained by the increase demand for travel, where the average number of vehicle miles travelled (VMT) per passenger cars and light-duty trucks increased by 46% from 1990 to 2017 (U.S. Environmental Protection Agency, 2019c).
Similar to other sectors, the lockdown and travel restrictions caused by the measures taken to cope with the pandemic have severely impacted the US transport sector. The EIA forecasts significant decreases in the consumption of motor gasoline, falling by 24% in the second quarter of 2020 compared to the second quarter of 2019 (U.S. Energy Information Administration, 2020f).
Passenger vehicles: the SAFE rule
The Trump administration passed a new rule on automobile fuel efficiency, called Safer Affordable Fuel-Efficient (SAFE) Vehicles (U.S. Environmental Protection Agency & U.S. National Highway Safety Administration, 2020), which rolls back stricter fuel efficiency standards of the Obama-era. The rule requires automakers to improve the fuel efficiency of their light duty vehicles by 1.5% year-to-year from model year 2021 to 2026, reaching 40 miles per gallon by 2025. Obama-era standards would have required a roughly 5% annual increase, reaching 54 miles per gallon by 2025. In the absence of any regulation, the automobile industry has achieved an average annual increase in fuel economy of 2.4% (International Council on Clean Transportation, 2018).
The new SAFE rule is the most significant regulatory rollback yet implemented and it would be major step backward in addressing the largest source of greenhouse gas emissions in the US. According to the official rule assessment, the rollback would allow cars to emit nearly 923 MtCO2 more over the lifetime of the vehicles produced between 2021–2026 than they would have emitted under the Obama standards (U.S. Environmental Protection Agency & U.S. National Highway Safety Administration, 2020). CAT calculations suggest that this could result in an increase in cumulative emissions of about 468 MtCO2e between 2020–2035. The Rhodium group estimates a cumulative increase of 654 MtCO2 in the same period (Rhodium Group, 2020).
The rollback itself is difficult to defend. A first draft of the economic analysis concluded that the rule would lead to greater costs than benefits for consumers, i.e. the lower costs of vehicles would not compensate the increased costs on fuel consumption due to lower fuel efficiencies (International Council on Clean Transportation, 2019). In order to justify the rollback, the agencies based a new assessment on questionable assumptions such as assuming vehicles sales decline due to efficiency improvements, underestimation of fuel savings for consumers and reducing energy and emission‑reduction benefits by 80%–90%. A group of 23 states are suing the administration to undo this rule (The New York Times, 2020b).
Passenger vehicles: revocation of the California waiver
In addition to the introduction of the SAFE rule, the government revoked California’s ability to set its own emission standards for cars and trucks that are stricter than the federal standards (U.S. Environmental Protection Agency & U.S. National Highway Safety Administration, 2019). This exemption had allowed California to implement stricter programs that aimed to limit air pollution and GHG emissions from the transport sector, including its Zero Emission Vehicle (ZEV) programme.
This rollback has also an effect on other states that have adopted California’s programmes to reduce emissions from light duty vehicles (LDVs). Thirteen other states and the District of Columbia, representing 31% of vehicles sales in the US have adopted part or all of California’s tighter standards, including nine states that adopted Zero Emissions Vehicle targets (America’s Pledge, 2019). Rolling back national fuel economy standards and revoking California’s waiver could increase emissions by 1–1.3 billion metric tons cumulatively (2020–2035) relative to Obama-era rules (Rhodium Group, 2019).
California and other 22 states have filed multiple lawsuits against this rule, most recently in November 2019 (Reuters, 2019a; State of California Department of Justice, 2019). In order to gain certainty, several automakers representing more than one third of the US market share made a voluntary agreement with California at a compromise level of 3.7% per year through the model year 2026 (Electrek, 2020), which is stricter than the weak 1.5% improvement of the rollback but lower than the 5% annual increased originally agreed between the federal agencies and California as a unified national programme to harmonise GHG emission standards and fuel efficiency standards.
Electric vehicles reached 2% of new vehicle sales nationwide in July 2018 (Kane, 2018). As a result of the SAFE rule change and revocation of California’s waiver, new EV sales are expected to remain flat until 2026. Without these rollbacks, new EV sales had been expected to increase to 12% of all vehicle sales in 2025 (U.S. Energy Information Administration, 2019a). Rolling back national fuel economy standards and revoking California’s waiver could reduce the share of EVs sold in 2035 by up to 8 percentage points nationwide (Rhodium Group, 2019). However, this could change if the legal challenges are successful.
At the global level, the last fossil fuel powered car will need to be sold by 2035 for Paris Agreement compatibility (Climate Action Tracker, 2016a).
EV market share
Freight transport
In freight transport, the Heavy-Duty Vehicle National Program sets greenhouse gas emissions and fuel efficiency standards for heavy-duty vehicles, which the EPA estimates will reduce emissions by 200 MtCO2/year by 2050 (U.S. Environmental Protection Agency & U.S. National Highway Safety Administration, 2016). To be compatible with the Paris Agreement’s long-term goal, freight trucks need to be almost fully decarbonised by around 2050 (Climate Action Tracker, 2018).
Industry
Direct GHG emissions in the industry sector accounted for 22% of total US emissions in 2018, making it the third largest contributor to the US GHG emissions after transport and electricity (U.S. Environmental Protection Agency, 2020b).
The consumption of fossil fuels in the industry sector is expected to decline in 2020 as a result of the economic slowdown. Natural gas consumption is expected to decrease by 3% in 2020 from the 2019 average because of lower consumption in the industrial sector (U.S. Energy Information Administration, 2020f).
Through the Significant New Alternatives Policy (SNAP) programme, in 2015 the Obama Administration had prohibited the use of certain hydrofluorocarbons (HFCs) in various end uses, specifying acceptable alternatives. HFCs are among the world’s most potent greenhouse gases, with warming potentials hundreds of times higher than CO2.
In April 2018, the EPA announced that it would not enforce the 2015 rule, allowing these HFCs to continue to be used (U.S. Environmental Protection Agency, 2018c). One year later, in April 2019, the US court of Appeals struck down the rule restricting the use of HFCs under the SNAP programme (The National Law Review, 2019), a decision later upheld by the US Supreme Court.
The original SNAP rule was estimated to reduce emissions by 54–64 MtCO2e/yr in 2025 and by 78–101 MtCO2e/yr in 2030 in comparison to a business as usual scenario (U.S. Environmental Protection Agency, 2015). California, Vermont and Washington states have adopted measures to backstop the SNAP rollback within their own jurisdictions, which were followed by announcements from New York, Maryland, Connecticut and Delaware with plans to adopt similar measures (World Resources Institute, 2020).
To meet the requirements of the Kigali Amendment of the Montreal Protocol, which the US has not yet ratified, it would need to implement more stringent standards than the SNAP programme (United Nations Treaty Collection, n.d.).
Buildings
In 2018, direct greenhouse gas emissions from buildings accounted for 12.2% percent of total U.S. greenhouse gas emissions, with 6.6% from commercial buildings and 5.6% from residential (U.S. Environmental Protection Agency, 2020b). Direct GHG emissions in buildings have remained relatively constant in the last decades, increasing 6% between 1990–2018.
The US has numerous federal and state level policies in the building sector, primarily focused on energy efficiency. These policies include the National Appliance Energy Conservation Act of 1987, with appliance standards that were updated in 2015, and the Energy Policy Act of 1992 and 2005, which includes whole house efficiency minimums. The EPA runs the Energy Star program, which uses a voluntary labelling system to increase consumer awareness of energy efficiency (U.S. Environmental Protection Agency and U.S. Department of Energy, 2019).
In February 2020, the Department of Energy (DOE) changed its decision-making process for energy efficiency standards rulemaking for consumer and commercial equipment (U.S. Department of Energy, 2020). The amended rule applies a threshold approach to determine whether projected energy savings would be “significant”, defined as saving at least 88 TWh (0.3 quads) of energy over 30 years or improving energy use by at least ten per cent above existing standards. This significantly raises the bar for the minimum energy efficiency improvements before the agency will even consider implementing it, thus endangering future attempts to update and improve appliances’ efficiency standards.
In September 2019, the government adopted a rule that repeals the Energy Conservation Standards for General Service Lamps, which sets energy-efficiency requirements for lightbulbs (U.S. Department of Energy, 2019). With this, it withdrew one of the last rules established by the previous administration that revised the definitions of general service lamps to set stricter efficiency standards for residential and commercial lightbulbs and which were to come into effect in 2020 (U.S. Department of Energy, 2017). CAT calculations indicate that this could result in an increase of 94 MtCO2e/yr between 2020–2028. The policy rollback does not have an effect in 2030 since it only postpones the development of efficient lightbulbs. The impact on emissions increase is reflected in post‑COVID‑19 current policy projections.
The US does not have federal targets for constructing net zero energy buildings (nZEBs), although California and Massachusetts do. This is in contrast to the EU, for example, which requires all new buildings to be nZEBs starting in 2020. For Paris Agreement-compatibility, all new buildings globally should be nZEBs starting in 2020, and renovation rates should increase to 3%–5% per year (Climate Action Tracker, 2016a).
Agriculture
GHG emissions from the agriculture sector accounted for 9% of national emissions, which have increased by about 9% percent since 1990 (U.S. Environmental Protection Agency, 2020b).
The US Department of Agriculture (USDA)’s “Building Blocks for Climate Smart Agriculture & Forestry” foresees a set of voluntary activities involving farmers and companies (U.S. Department of Agriculture, 2015). The measures target reductions in emissions from agriculture (e.g. improved fertiliser use and other agricultural practices, avoiding methane from livestock) and land use and forestry (e.g. improved soil management, avoid deforestation and reforestation).
Forestry
Historically, the LULUCF sector has been a net sink for greenhouse gas emissions in the US, ranging between 0.6 and 0.8 GtCO2e annually between 1990 and 2018.
In October 2019, the government proposed reversing a long-standing rule that limits logging in the largest national forest, Alaska’s Tongass National Forest (U.S. Department of Agriculture, 2019). The proposed rule would open up nearly half of the 16.7 million-acre Tongass National Forest to logging, reducing the sinks from forestry and land use. A final rule is not expected until the second half of 2020.
Waste
The EPA finalised standards to reduce methane emissions from new, modified, and reconstructed municipal solid waste landfills in 2016. In August 2019, the EPA passed a rule to amend the standards, postpone the compliance period, and postpone the due date for state plans to limit methane emissions from landfills (U.S. Environmental Protection Agency, 2019a). This could mean increased emissions from landfills in the future.
Further analysis
Latest publications


Stay informed
Subscribe to our newsletter