International Shipping
Targets
Summary table
In April 2018, the IMO adopted its initial strategy to reduce GHG emissions (IMO, 2018). While the strategy recognises the need for emissions to “peak and decline” and to pursue “efforts towards phasing them out as called for in the Vision as a point on a pathway of CO2 emissions reduction consistent with the Paris Agreement temperature goals”, it includes one target for 2030 and two targets for 2050, both compared to 2008 baseline. The 2008 baseline used to define IMO targets in 2018 was at the historical highest point of speed of ships generating higher emissions. Following the 2008 crisis, as a response to falling demand, carriers have reduced supply capacity by scrapping older vessels, cancelling orders for new ships and lowering ship speeds, to avoid freights rates reduction which drove to emissions reduction (Spero & Raval, 2013).
2030 target
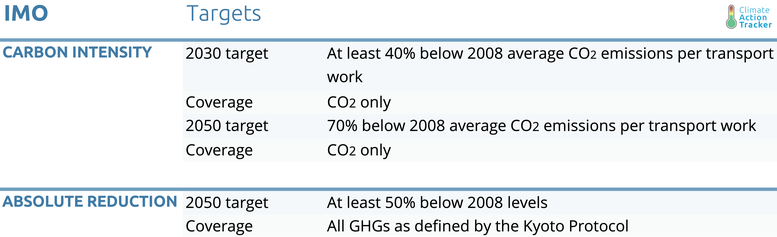
Under the initial strategy, IMO member countries have agreed to cut carbon intensity of the fleet by at least 40% below 2008 levels by 2030. IMO member countries are set to overachieve this target by a wide margin. We calculate that under this carbon intensity target, CO2 emissions would have to be around 1,177-1,241 Mt CO2 in 2030, depending on the growth in trade, under pre-COVID projections, representing an increase of 29-36% above 2008 emissions levels. Under COVID-19, emissions in 2030 could be between 925-969 MtCO2, in the case of a slow recovery, representing a 1-6% increase in emissions above 2008, while would reach levels of pre-COVD projections in the case of a fast recovery.
This target is not very ambitious, borne out by the fact that the sector had already reached more than a 30% reduction in carbon intensity in 2018 (Comer et al., 2018; A. D. (ICCT) Rutherford et al., 2020). Industry players and think tanks are calling for the revised 2023 strategy to increase the targets (Climate Home News, 2020; Ship & Bunker, 2020).
2050 target
The initial strategy also calls for the carbon intensity of international shipping to reach 70% below 2008 levels by 2050. We calculate that pre-COVID CO2 emissions would have been 1,116-1,186 MtCO2 in 2050 under this target, depending on the growth in trade, corresponding to 22%-29% above 2008 levels of emissions. Under COVID-19, emissions in 2050 could be between 877-926 MtCO2, in the case of a slow recovery, representing a 4% decrease in emissions below 2008 to 1% increase in emissions above 2008, while would reach levels of pre-COVD projections in the case of a fast recovery. In both pre and post COVID projections, the industry sector is set to miss its 2050 target, depending on growth of trade.
Further, the strategy also includes a target for 2050 of cutting all GHG emissions by at least 50% below 2008 levels. If applied to CO2 only, emissions would be 458 Mt in 2050 while it would be 471 MtCO2eq if applied to all GHG emissions.
While the absolute target is stronger than the carbon intensity target, there is room for further strengthening particularly in light of the IMO strategy aiming to reduce emissions “pursuing efforts towards phasing them out as called for in the Vision as a point on a pathway of CO2 emissions reduction consistent with the Paris Agreement temperature goals” (IMO, 2018). Studies show that cost-effective full-decarbonisation of the sector is possible before 2050 (Energy Transitions Commission, 2019; OECD, 2018).
Other targets
Some actors within the sector have also adopted emission reduction targets. For example:
- Maersk, the world’s largest container shipping company, has pledged to achieve net-zero emissions from operations in 2050 and to have developed carbon neutral vessels, commercially viable, by 2030 (MAERSK, 2019).
- The Port of Rotterdam, the largest port in EU and, in 2018 the world’s 11th largest port in terms of container cargo handling, has committed to cut its emissions by 49% in 2030 below 1990 levels and 95% by 2050, including maritime transport from and to the Port of Rotterdam corresponding to 87% of its emissions (Port of Rotterdam, 2017; UNCTAD, 2019).
Further analysis
Latest publications


Stay informed
Subscribe to our newsletter