
USA
Assumptions
Historical data
Historical emissions are inventory submissions to the UNFCCC, reported in the Common Reporting Format (UNFCCC, 2018).
Pledges
Targets for 2020 and 2025 were calculated from the 2018 national inventory submissions.
For the 2020 pledge, NDC, and long-term target, we apply the indicated reduction to the 2005 inventory data for 2005 including LULUCF, and then subtract the projected emissions for the LULUCF sector. The LULUCF emission projections up to 2030 were taken from the 6th National Communication, which reported sinks of 0.6–0.9 GtCO2e/year in 2025. (United States of America, 2014). The 2016 CAT update used LULUCF projections from the 2nd Biennial report, which reported a sink of 0.9 to 1.2 GtCO2e/year in the same year. The methodological changes in the 2nd Biennial Report increased the sink from forest and land use by about 4.3 to 5.1%-points compared to the total emission level in the base year, 2005, rendering the target for the remaining sectors 3.9 to 4.6%-points easier to achieve. The sinks in the 2nd Biennial report were calculated with a different methodology than LULUCF in the CRF historical data for 2005, on which the NDC target is based, making these values incompatible with the historical data. We have therefore returned to using projections from the 6th National Communication, which is consistent with the historical data. The LULUCF projections for 2050 were taken from the Mid-Century Strategy document and represent the full range of modeled sink scenarios in the report (The White House, 2016).
Current policy projections
The current policy projection was done in four steps:
- First, energy-related CO2 emissions projections were taken from EIA’s Annual Energy Outlook 2018 (U.S. Energy Information Administration, 2018a). We use two scenarios from the Annual Energy Outlook – the reference scenario and the low economic growth scenario – to create a range of emissions projections. The economic growth assumptions in the reference scenario are higher than those projected by the Congressional Budget office in June, 2017 (Congressional Budget Office, 2017), whereas the low economic growth scenario assumptions are slightly lower. We therefore use both scenarios to better capture the range of possible economic growth scenarios.
- Second, industrial process CO2 emissions were projected by applying the historical ratio (2000-2015) of industrial process CO2 emissions to industrial energy-related emissions to projections of industrial energy related emissions from the Annual Energy Outlook 2018 Reference Case.
- Third, other GHG emission projections were taken from the 2nd Biennial Report, based on the Current Measures scenario, which includes policies that were implemented through mid-2015 (U.S. Department of State, 2016).
- Fourth, all the aforementioned emissions were aggregated and then harmonised to historical data by applying the annual percentage change estimated from the projected dataset to the historical inventory data.
The US has failed to submit a new Biennial Report to the UNFCCC by the end of 2017 deadline. When such a report is submitted, we will update emissions projections for non-CO2 GHGs accordingly.
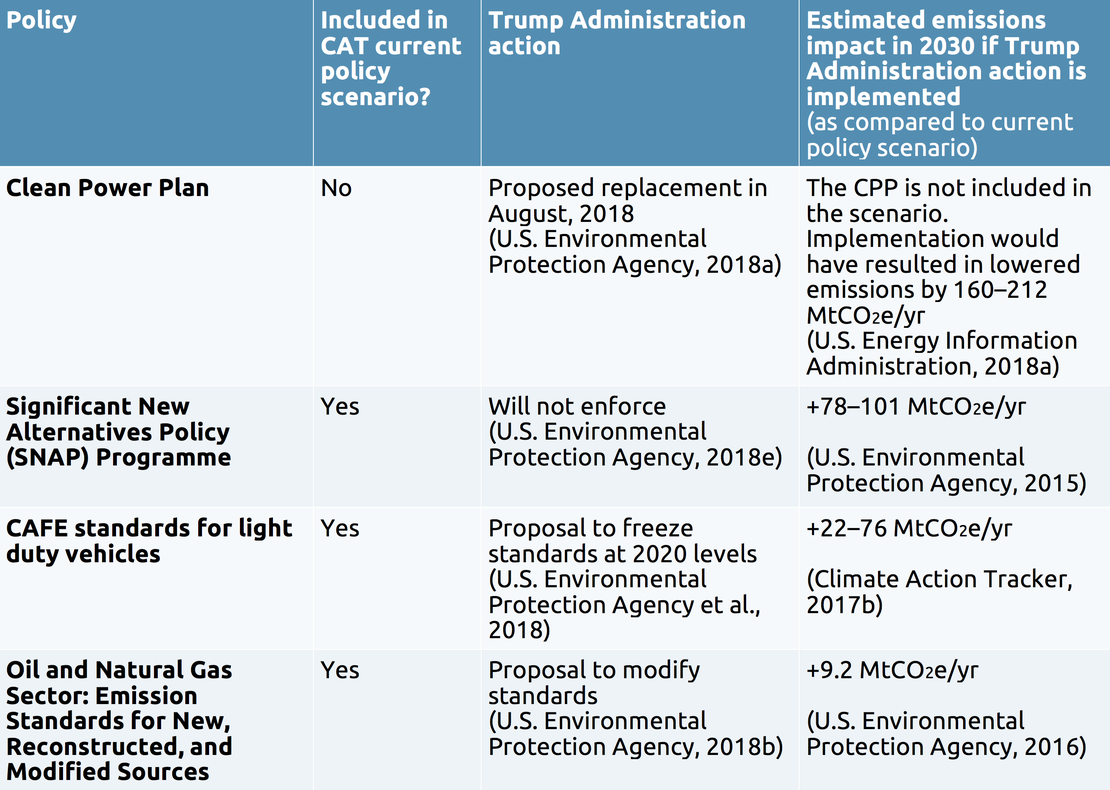
The emissions projections reported here for 2025 (6,358 – 6,518 MtCO2e/year, excl. LULUCF) are in line with emissions projections under Trump Administration policies reported in the literature. A recent analysis by Rhodium Group projects 6,350 MtCO2e/year excluding LULUCF under baseline economic growth assumptions using AR4 GWPs (Larsen et al., 2017). The Rhodium Group projections differ from the CAT projections for three main reasons: 1. They include targets for HFC reductions under the Kigali Amendment, which the CAT does not because the US has not ratified the amendment. 2. They use lower renewables prices than the Annual Energy Outlook, on which the CAT energy sector projections are based. 3. They assume that increasingly stringent standards will be introduced for light-duty and heavy-duty vehicles, whereas the Annual Energy Outlook assumes that federal standards will remain constant after 2018 for heavy duty vehicles and 2025 for light duty vehicles. Another recent analysis by Resources for the Future (Hafstead, 2017) reports emissions of 6760 MtCO2e/year in 2025 using AR4 GWPs for a “best case” scenario under Trump Administration policies.
Global Warming Potentials
Previous assessments of the Climate Action Tracker used the global warming potentials (GWPs) from the IPCC’s Second Assessment Report (SAR). For this assessment we have updated all figures and time series to GWPs from the Fourth Assessment Report (AR4). For the USA, this results in higher estimated emissions levels for historical data, pledges, and emissions projections.
Further analysis
Latest publications


Stay informed
Subscribe to our newsletter