
USA
Assumptions
Historical emissions
Historical emissions were taken from 2019 inventory emissions developed by the U.S. Environmental Protection Agency (U.S. Environmental Protection Agency, 2019c). The last available historical data year is 2017.
2020 pledges
For the 2020 pledge, NDC, and long-term target, we apply the indicated reduction to the 2005 base year including LULUCF, and then subtract the projected emissions for the LULUCF sector.
The LULUCF emission projections up to 2030 were taken from the 6th National Communication, which reported sinks of 0.6–0.9 GtCO2e/year in 2025 (U.S. Department of State, 2014). The 2016 CAT update used LULUCF projections from the 2nd Biennial report, which reported a sink of 0.9–1.2 GtCO2e/year in the same year (Climate Action Tracker, 2016b; U.S. Department of State, 2016). The sinks in the 2nd Biennial report were calculated with a different methodology than LULUCF in the historical inventory data reported to UNFCCC for 2005, on which the NDC target is based, making these values incompatible with the historical data. We have therefore returned to using projections from the 6th National Communication, which is consistent with the historical data.
The USA has not submitted its 7th National Communication, which was due on 1 January 2018, therefore more recent LULUCF projections are not available.
The LULUCF projections for 2050 were taken from the Mid-Century Strategy document and represent the full range of modelled sink scenarios in the report (The White House, 2016).
Current policy projections
The current policy projection was done in three steps:
- First, we estimate the baseline for total emissions projections under current policies as the aggregation and harmonization of three components:
- Energy-related CO2 emissions: The projections were taken from EIA’s Annual Energy Outlook 2019 (U.S. Energy Information Administration, 2019a). We use two scenarios from the Annual Energy Outlook – the reference scenario and the low economic growth scenario – to create a range of emissions projections. The economic growth assumptions in the reference scenario are lower than those projected by the Congressional Budget office in May 2019 (U.S. Congressional Budget Office, 2019), but are broadly aligned with historical trends.
- Industrial process CO2: The emissions were projected by applying the historical ratio (2000-2017) of industrial process CO2 emissions to projections of industrial energy-related emissions from the Annual Energy Outlook 2019 Reference Case.
- Other GHG emissions: The projections were updated and taken from the Global Non-CO2 Greenhouse Gas Emission Projections & Mitigation Potential: 2015-2050, based on the baseline scenario, which includes policies that were implemented through until early 2019 (U.S. Environmental Protection Agency, 2019b). We did not consider alternative economic growth scenarios for other GHG emissions.
- Second, all the aforementioned emissions were aggregated and then harmonised to historical data by applying the annual percentage change estimated from the projected dataset to the historical inventory data.
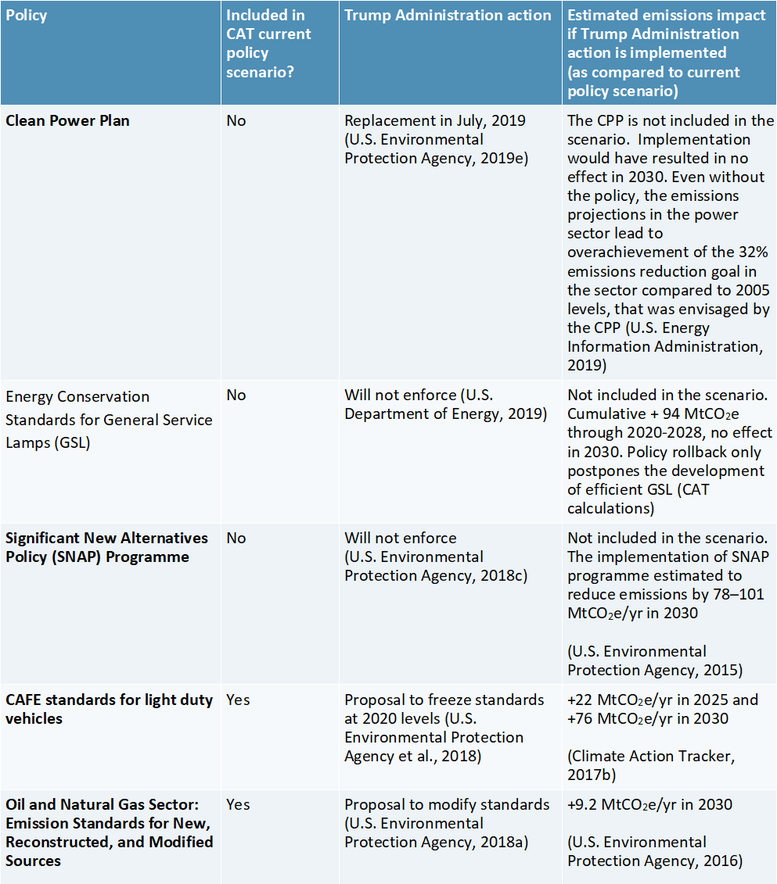
- Third, the quantification of two policy rollbacks was incorporated in the baseline projections (which were part of the policies considered in the baseline scenario taken from EIA’s Annual Energy Outlook 2019 and the 2nd Biennial Report):
- Repeal of energy-efficient lightbulbs: We calculate energy intensities projections (2017-2050) related to lighting appliances in the residential and commercial sectors (TWh/sq ft) based on data from EIA’s Annual Energy Outlook 2019. Energy intensity improvements for commercial and residential buildings follow a linear trend between 2017-2028, contrary to a drastic drop in energy intensities after 2020, when stricter efficiency requirements for lightbulbs were to go into effect. After 2028, energy intensities converge to what was projected in EIA’s Annual Energy Outlook 2019. The resulting energy intensities are then applied to the increasing average square footage in both sectors (as reported by AEO 2019). The resulting energy demand from lighting appliances (TWh) was translated into yearly emissions based on the projected annual emissions intensity in power supply (MtCO2/TWh). The impact of the policy rollback is calculated as the difference in emissions compared to when the policy rollback is not quantified.
- The non-enforcement of the SNAP program regarding the use of HFC: The original SNAP rule was estimated to reduce emissions by 54–64 MtCO2e/yr in 2025 and by 78–101 MtCO2e/yr in 2030 in comparison to a business as usual scenario (U.S. Environmental Protection Agency, 2015). These emissions ranges are added up to the baseline projections. Linear interpolation is used for the gap years in between.
As of October 27, 2019, the US had still not submitted its third Biennial Report and seventh National Communication to the UNFCCC, the deadline for which was 1 January 2018. One implication of this failure to report is that it makes it more difficult for independent analysts, like the Climate Action Tracker, to accurately assess future emissions development in the US, particularly for non-energy CO2 and non-CO2 emissions.
Global Warming Potentials
The CAT uses Global Warming Potential (GWP) values from the IPCC’s Fourth Assessment Report (AR4) for all its figures and time series. Assessments completed prior to December 2018 (COP24) used GWP values from the Second Assessment Report (SAR).
Further analysis
Latest publications


Stay informed
Subscribe to our newsletter