
USA
Current Policy Projections
Economy-wide
US emissions are projected to remain relatively constant in the next decade, reaching between 6.4 and 6.5 GtCO2e/year by 2025 (excl. LULUCF), and between 6.3 and 6.5 GtCO2/year by 2030. This level of emissions in 2025 is equivalent to or slightly above (0–2%) 1990 levels of emissions, and only 11%–13% below 2005 levels. Under this policy scenario, which includes current federal and state level policies, the US will not meet its (already weak) NDC target.
The US is very close to achieving the less ambitious end of its 2020 target, as current policies are projected to result in emissions of 11% below 2005 levels in 2020 (excl. LULUCF) and its 2020 target is 14–17% below 2005 levels (excl. LULUCF).
Compared to CAT projections in 2018, emissions in the building sector are expected to increase between 2020‑2028 due to the repeal of energy-efficiency requirements for lightbulbs (U.S. Department of Energy, 2019). Similarly, current projections present higher non-CO2 emissions due to the non-enforcement of the Significant New Alternatives Policy (SNAP) programme that would limit HFC gases emissions (U.S. Environmental Protection Agency, 2018c).
The EIA’s Annual Energy Outlook 2019 (AEO) projects 8% lower emissions from electricity generation as compared to the 2018 outlook (reference case), despite increased generation overall, with increased electricity generation from gas and renewables, and decreased generation from coal (U.S. Energy Information Administration, 2019a). Coal is projected to account for 22% of generation in 2030 (down from the 26% projected in 2018), gas for 38% (compared to 34% projected in 2018), and renewables for 24% (compared to 23% projected in 2018), with nuclear making up the rest.
There are differing projections for renewables: the US government projects renewables to reach 24% in 2030 and 31% in 2050. Bloomberg New Energy Finance projects much higher renewables shares of 55% in 2050.
Since the beginning of 2018, the US Environmental Protection Agency (EPA) has worked on a replacement for the Clean Power Plan (CPP), in September 2019 presenting a weaker plan called the Affordable Clean Energy (ACE) (U.S. Environmental Protection Agency, 2019e). The CPP aimed to reduce emissions from the power sector by 32% below 2005 levels by 2030, by setting targets for each state individually.
Even though the government replaced the CPP, the EIA’s Annual Energy Outlook 2019 projections show the power sector will still overachieve the CPP’s original target by reducing emissions in the electricity sector by 34% below 2005 levels by 2030 (U.S. Energy Information Administration, 2019a).
The government has also repealed energy efficiency requirements for lightbulbs (U.S. Department of Energy, 2019), has weakened methane emissions standards for oil and gas facilities (U.S. Environmental Protection Agency, 2018a), has proposed freezing emissions standards for light-duty vehicles after 2020 (U.S. Environmental Protection Agency, Administration, & U.S. National Highway Safety Administration, 2018), and will not enforce measures to reduce HFC emissions (U.S. Environmental Protection Agency, 2018c).
Depending on the outcome of legal action against some of these proposals (see Columbia Law School Sabin Center for Climate Change Law, 2019 for details), emissions could rise 85 MtCO2e/yr above the current policy scenario in 2030, which already excludes the CPP and considers the impacts of lower energy efficiency requirements for lightbulbs and the non-enforcement of the SNAP programme (see footnote 1 and table in assumptions section).
Conversely, increased state and local action, in addition to market pressures, may contribute to additional reductions. An analysis of recorded and quantified commitments from sub-national and non-state actors in the US suggests that if these commitments were fully implemented, they could result in emissions reductions of 17–24% below 2005 levels in 2025 (incl. LULUCF), and thus bring the country within striking distance of its NDC target (America’s Pledge, 2018; Data Driven Yale, NewClimate Institute, & PBL, 2018). These commitments are not included in the CAT current policy scenario unless they are supported by implemented policies (see table below).
Also not included in the CAT current policy scenario, but politically important in the US, is the Green New Deal resolution that was introduced in the US House of Representatives in February 2019 (Ocasio-Cortez, 2019). The non-binding resolution called for economy-wide action to reach net-zero GHG emissions and would serve as an overarching strategy document that would still need to be implemented through specific policies.
The plan broadly addresses all major emitting sectors including targets to meet 100% of power demand through zero-emission energy sources, increase energy efficiency in buildings, grow clean manufacturing, overhaul transportation systems, work with farmers and ranchers to reduce emissions from agriculture, preserve and afforest land, and support other countries to achieve their own Green New Deals.
While the Green New Deal did not get Senate approval to move forward into any kind of law (Republican Senate Leader, Mitch McConnell, put it to the vote immediately, and it was rejected 57-0), it nevertheless has sparked a discussion about the need for a much stronger approach to climate action in the US.
Energy supply
Electricity supply contributed to 28% of the total 2017 US GHG emissions (U.S. Environmental Protection Agency, 2019c). Total annual emissions in the power sector have declined steadily since 2010, which, in 2017, dropped from being the largest source of GHG emissions to second-largest, after transport. The decline is mainly driven by a shift in generation to lower and non-emitting sources of generation, such as natural gas and renewables (see below).
The Clean Power Plan, which the Obama Administration issued under the Clean Air Act, aimed to reduce emissions from the power sector by 32% below 2005 levels by 2030 by setting targets for each state individually. Even though the government has replaced the CPP, the EIA’s Annual Energy Outlook 2019 projections show that the market forces of cheaper renewables and gas will displace dirtier coal and will allow the power sector to still overachieve the CPP’s original target by reducing emissions by 34% below 2005 levels by 2030 (U.S. Energy Information Administration, 2019a). This highlights that the CPP targets were not ambitious and that the Trump Administration has not reversed the trend of uptake of renewables and the declining participation of coal.
The proposed replacement to CPP, called the Affordable Clean Energy (ACE), limits the scope of the plan to emissions reductions inside the fence at individual power plants, for example through efficiency measures or carbon capture and storage technologies and give states the ability to set their own rules (U.S. Environmental Protection Agency, 2019e). The ACE rule is a significant departure from the CPP, which would have required entire states to meet emissions standards.
The government has also proposed weakening emissions standards for new coal-fired power plants from the 2015 standard of 635 gCO2/kWh to between 860 and 1000 gCO2/kWh depending on the type of plant (U.S. Environmental Protection Agency, 2018b). As of October 2019, EPA was in the process of issuing a final rule on the matter (U.S. Office of Information and Regulatory Affairs, 2019).
The emissions intensity of total electricity generation in the US has decreased over the past 15 years, from a high point of 636 gCO2/kWh in 2001 to 455 gCO2/kWh in 2015.
On a global level, Paris Agreement compatibility requires a completely decarbonised electricity sector by 2050 (Climate Action Tracker, 2016a). Based on EIA, the following developments in renewable energy are highlighted (U.S. Energy Information Administration, 2018a).
- Utility scale solar PV installations were up 10% in the US in the first half of 2018 from the first half of 2017 (Jan-Jun);
- Onshore wind installations were down 44% from the first half of 2017;
- Coal plant retirements doubled. The market forces of cheaper renewables and gas have put coal-fired power producers under economic pressure, with eight of them filing bankruptcy this year (Krauss, 2019);
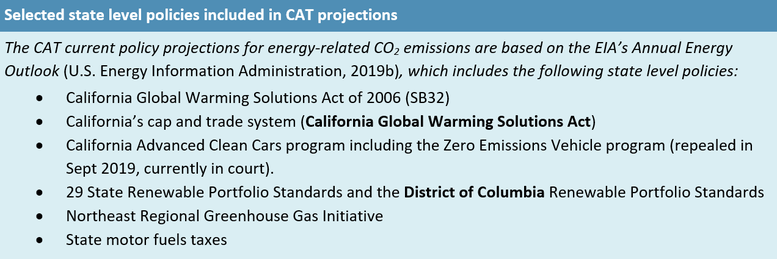
- At the subnational level, 29 states and district of Columbia have mandatory renewable portfolio standards, and nine have voluntary renewable energy targets (U.S. Energy Information Administration, 2019b);
- Five US cities have already achieved their goals of 100% renewable energy (America’s Pledge, 2017).
In the past, the EPA and the Bureau of Land Management (BLM) have set a series of standards to reduce methane and volatile organic compounds emissions from oil and gas production. However, in 2018, the EPA proposed to change emissions standards for new, reconstructed, and modified sources in the oil and natural gas sector, the effect of which is to allow methane leaks to continue for longer before they are found and fixed. If the rule were to be rescinded, emissions could rise 9.2 MtCO2e/yr above current policy scenario in 2030 (U.S. Environmental Protection Agency, 2016). A final rule is not expected before 2020 (U.S. Environmental Protection Agency, 2019d).
The BLM has also reinstated pre-2016 regulations, replacing more recent regulations that were designed to limit methane waste from oil and gas production on public lands (U.S. Bureau of Land Management, 2018).
In 2018, the US became the world’s largest producer of crude oil (U.S. Energy Information Administration, 2018b); it is already the largest producer of natural gas (U.S. Energy Information Administration, 2018c). US LNG exports grew by 53% in 2018 (Lester, 2019). The steady upward trend continued during the first half of 2019, when average net exports of natural gas more than doubled compared to average levels in 2018 (U.S. Energy Information Administration, 2019d). With this significant increase, in 2019 the US became the world’s third-largest LNG exporter, behind Australia and Qatar (U.S. Energy Information Administration, 2019c).
Although natural gas is often seen as a ‘clean’ source of energy, extracting, transporting and burning it in demand sectors still emits GHG. To achieve the Paris Agreement’s long-term temperature goal, the power sector needs to rapidly transition to being carbon-free by around 2050. This requirement for a complete CO2 emissions phase-out results in a dwindling role for natural gas in the power sector towards the middle of the century (Climate Action Tracker, 2017a).
Continuing with the series of actions that weakens climate policy, the Trump Administration has established its final plan to open Alaska’s National Wildlife Refuge (ANWR) to oil and gas drilling (U.S. Department of the Interior, 2019). The government has also proposed weakening the Endangered Species Act (U.S. Fish and Wildlife Service, 2019), which would allow reducing the amount of habitat set aside for wildlife, favour economic assessments when deciding which species to protect, and remove tools that officials use to predict future harm to species as a result of climate change. This limits how regulators assess the impacts of the climate crisis and will make it easier to expand oil and gas drilling.
Industry
Direct GHG emissions in the industry sector accounted for 22% of total US emissions in 2017, making it the third largest contributor to the US GHG emissions after transport and electricity (U.S. Environmental Protection Agency, 2019c).
Through the Significant New Alternatives Policy (SNAP) programme, the Obama Administration prohibited the use of certain hydrofluorocarbons (HFCs) in various end uses in 2015, and specified acceptable alternatives. HFCs are among the world’s most potent greenhouse gases, with warming potentials hundreds of times higher than CO2.
In April 2018, the EPA announced that it would not enforce the 2015 rule, allowing these HFCs to continue to be used (U.S. Environmental Protection Agency, 2018c). One year later, in April 2019, the US court of Appeals struck down the rule restricting the use of HFC under SNAP program (The National Law Review, 2019), which was later upheld by the US Supreme Court. The original SNAP rule was estimated to reduce emissions by 54–64 MtCO2e/yr in 2025 and by 78–101 MtCO2e/yr in 2030 in comparison to a business as usual scenario (U.S. Environmental Protection Agency, 2015).
To meet the requirements of the Kigali Amendment of the Montreal Protocol, which the US has not yet ratified, it would need to implement more stringent standards than the SNAP programme (United Nations Treaty Collection, 2016).
Transport
In 2017, GHG emissions from the transport sector accounted for about 29% of total emissions in the US, becoming the largest contributor in GHG emissions for the first time since 1990 (U.S. Environmental Protection Agency, 2019c). This is explained by the increase demand for travel, where the average number of vehicle miles travelled (VMT) per passenger cars and light-duty trucks increased by 46% from 1990 to 2017 (U.S. Environmental Protection Agency, 2019c).
In passenger transport, the Corporate Average Fuel Economy (CAFE) standards for Light-Duty Vehicles (LDV) limit greenhouse gas emissions from cars and trucks through fuel efficiency and were set through 2025 under the Obama Administration.
Electric vehicles reached 2% of new vehicle sales nationwide in July 2018 (Kane, 2018). In San Jose, California, 13% of all new vehicles sold in 2017 were electric (Lutsey, 2018). If state-level targets and the CAFE standards go into full effect, the US government projections expect sales of EV reach 1.8 million in 2025, or about 12% of projected total vehicle sales (U.S. Energy Information Administration, 2019a). On a global level, the last fossil fuel powered car will need to be sold by 2035 for Paris Agreement compatibility (Climate Action Tracker, 2016a).
In August 2018, the EPA and National Highway Safety Administration (NHTSA) proposed a replacement rule called the Safer Affordable Fuel-Efficient (SAFE) Vehicles Rule that would freeze standards at 2020 values, instead of requiring the phasing in of more stringent standards over time (U.S. Environmental Protection Agency et al., 2018). CAT calculations suggest that this could result in emissions increases of 22 MtCO2e/yr in 2025 and 76 MtCO2e/yr in 2030 (Climate Action Tracker, 2017b). The EPA and NHTSA announced that they plan to release a final set of nationally applicable emissions rules for vehicles (SAFE) by the end of 2019 (U.S. Environmental Protection Agency & U.S. National Highway Safety Administration, 2019), at which time lawsuits to impede its implementation may be filed (State of California Department of Justice, 2019).
In the same rule, the government revokes California’s ability to set its own emission standards for cars and trucks that are stricter than the federal standards (U.S. Environmental Protection Agency & U.S. National Highway Safety Administration, 2019). This has allowed California to implement stricter programs that aim to limit air pollution and GHG emissions from the transport sector, including Zero Emission Vehicle (ZEV) Program.
This rollback has also an effect on other states that have adopted California’s programmes to reduce emissions from LDVs, such as California’s Advanced Clean Cars programme (California Air Resources Board, 2012). Thirteen other states and the District of Columbia have adopted part or all of California’s tighter standards, including nine states that adopted Zero Emissions Vehicle targets (America’s Pledge, 2017).
Blocking California and other states from implementing stricter state-level standards and the plans to weaken automobile emissions standards nationwide would be a major step backward in reducing emissions in the transport sector, which is the largest source of greenhouse gas emissions in the US. California and other 22 states have filed multiple lawsuits against this rule, most recently in September 2019 (State of California Department of Justice, 2019), after negotiations with the Trump Administration broke down in February (Volcovici & Shepardson, 2019).
In freight transport, the Heavy-Duty Vehicle National Program sets greenhouse gas emissions and fuel efficiency standards for heavy-duty vehicles, which the EPA estimates will reduce emissions by 200 MtCO2/year by 2050 (U.S. Environmental Protection Agency & U.S. National Highway Safety Administration, 2016). To be compatible with the Paris Agreement’s long-term goal, freight trucks need to be almost fully decarbonised by around 2050 (Climate Action Tracker, 2018).
Buildings
In 2017, direct greenhouse gas emissions from buildings accounted for 11% percent of total U.S. greenhouse gas emissions, with 6% from commercial buildings and 5% from residential (U.S. Environmental Protection Agency, 2019c). Direct GHG emissions in buildings have remained relatively constant in the last decades, increasing 3.4% between 1990-2017.
The US has numerous federal and state level policies in the building sector, primarily focused on energy efficiency. These policies include the National Appliance Energy Conservation Act of 1987, with appliance standards that were updated in 2015, and the Energy Policy Act of 1992 and 2005, which includes whole house efficiency minimums. The EPA runs the Energy Star program, which uses a voluntary labelling system to increase consumer awareness of energy efficiency (U.S. Environmental Protection Agency and U.S. Department of Energy, 2019).
In September 2019, the government adopted a rule that repeals the Energy Conservation Standards for General Service Lamps, which sets energy-efficiency requirements for lightbulbs (U.S. Department of Energy, 2019). With this, it is withdrawing one of the last rules established by the previous administration that revised the definitions of general service lamps to set stricter efficiency standards for residential and commercial lightbulbs and which were to come into effect in 2020 (U.S. Department of Energy, 2017). CAT calculations indicate that this could result in an increase of 94 MtCO2e/yr between 2020-2028. The policy rollback does not have an effect in 2030 since it only postpones the development of efficient lightbulbs. The impact on emissions increase is reflected in 2019 CAT projections of current policies.
The US does not have federal targets for constructing net zero energy buildings (nZEBs), although the states of California and Massachusetts do. This is in contrast to the EU, for example, which requires all new buildings to be nZEBs starting in 2020. For Paris Agreement-compatibility, all new buildings globally should be nZEBs starting in 2020, and renovation rates should increase to 3%–5% per year (Climate Action Tracker, 2016a).
Agriculture
GHG emissions from the agriculture sector accounted for 9% of national emissions, which have increased by about 9% percent since 1990 (U.S. Environmental Protection Agency, 2019c).
The US Department of Agriculture (USDA)’s “Building Blocks for Climate Smart Agriculture & Forestry” foresees a set of voluntary activities involving farmers and companies (U.S. Department of Agriculture, 2015). The measures target reductions in emissions from agriculture (e.g. improved fertiliser use and other agricultural practices, avoiding methane from livestock) and land use and forestry (e.g. improved soil management, avoid deforestation and reforestation).
Forestry
Historically, the LULUCF sector has been a net sink for greenhouse gas emissions in the US, ranging between 0.6 and 0.8 GtCO2e annually between 1990 and 2017. The achievement of future mitigation targets can also depend on the level of sinks coming from the forestry sector (LULUCF): the 6th National Communication, used in the CAT analysis, projected that the US forestry sector will absorb between 0.6 and 0.9 GtCO2e/year between 2020 and 2030 (10–17% of the NDC target) (U.S. Department of State, 2014). In the 2nd Biennial Report, these numbers were revised upwards, with a projected forestry sector sink of between 1.0 and 1.2 GtCO2e/year in 2020, 0.9 and 1.2 GtCO2e/year in 2025 (16–23% of NDC target), and 0.7–1.1 GtCO2e/year in 2030. These higher values would make it easier for the US to achieve its NDC. The USA has not submitted its 7th National Communication, which was due on 1 January 2018, therefore more recent LULUCF projections are not available.
In October 2019, the government proposed reversing a long-standing rule that limits logging in the largest national forest, Alaska’s Tongass National Forest (U.S. Department of Agriculture, 2019). The proposed rule would open up nearly half of the 16.7 million-acre Tongass National Forest to logging, reducing the sinks from forestry and land use. A final rule is not expected until June 2020.
Waste
The EPA finalised standards to reduce methane emissions from new, modified, and reconstructed municipal solid waste landfills in 2016. In August 2019, the EPA passed a rule to amend the standards, postpone the compliance period, and postpone the due date for state plans to limit methane emissions from landfills (U.S. Environmental Protection Agency, 2019a). This could mean increased emissions from landfills in the future.
Further analysis
Latest publications


Stay informed
Subscribe to our newsletter