
Indonesia
Current Policy Projections
Economy-wide
In 2030, under the CAT current policies scenario, GHG emissions excl. LULUCF will increase to 1,357-1,401 MtCO2e/year, about four times 1990 levels, and 72% to 67% higher than 2014 emissions. With these projections, Indonesia overachieves its unconditional NDC and potentially even the conditional 2030 targets as well (excl. forestry), despite strongly increasing emissions and not achieving other national targets, e.g. the National Energy Policy, or NDC reductions for LULUCF emissions.
Indonesia’s development planning is conducted in five-year cycles. The long-term plan, or RPJMN, spans the period from 2005 to 2025. This period is further divided into four five-year medium-term stages. Each one of these stages has a medium-term development plan, or RPJMNs. Through these medium-term plans, new governments can set their own priorities in the process of national development.
In 2019, Indonesia published its RPJMN 2020-2024 medium term plan, which includes strategies and targets that will guide the country’s development for the next five years (Ministry of National Development Planning (Bappenas), 2019). The RPJMN could result in emissions of 1,222 MtCO2e/year excl. LULUCF in 2030 as shown in the lower range of our planned policies projections.
Energy supply
Recent developments in Indonesia represent an apparent mismatch in the context of energy policy. On the one hand, renewables are being supported to play a stronger role in the energy mix, for example, through policies that aim to foster the use of rooftop PV. On the other hand, Indonesia has been locking in fossil fuels to play a considerable role in the long-term despite the power outages, caused by gas power plants, that hit Jakarta, Java, and Bali in 2019 (Ed Adamczyk, 2019).
Investment decisions to build coal-fired power plants have been on a declining trend since 2014 in Southeast Asia, except for Indonesia (IEA, 2017). While achieving the targets of the NEP and RPJMN 2020-2024 would result in emission reductions compared to current policy projections, it is to be noted that even under those targets the roles of especially coal, but also oil and gas, would remain locked-in across the coming decades, making a deep reduction of emissions extremely difficult and very costly.
The new RPJMN 2020-2024 includes more ambitious targets for the electricity sector than announced at the beginning of the year. According to the electricity supply plan (RUPTL) published in January 2019, renewable power capacity was projected to increase by 8.0 GW until 2024; the RPJMN projects an increase over three times higher, reaching 37.3 GW in 2024. This target is more ambitious but there is no update in targets regarding the expected emissions trajectory up to 2030, nor the renewables’ participation in total primary energy supply.
Recent policies to foster renewables development have not been so effective. Regulation 50/2017 stipulates new mechanisms for purchasing renewable electricity but caps power purchase prices at 85% of the local average generation cost in several regions (MEMR Indonesia, 2017b). Regulation 49/2018 establishes a net metering scheme in which the users are compensated for only 65% of the electricity they put into the grid (MEMR Indonesia, 2018b).
Both regulations result in prices that are too low for investors to make a reasonable profit against highly subsidised coal and do not account for the broader social benefits of investing in renewables (Suharsono et al., 2019). While they support keeping consumer prices and overall subsidies at current levels, they do not bring Indonesia closer to meet its renewable targets.
The primary energy mix remains vastly dominated by fossil fuels with a share of approximately 67% for coal, oil, and gas (see chart below). The situation is no different for power generation, where the fossil fuel share is at 90%. 74 new contracts for renewable power plants were signed between 2017 and 2018, adding about 1.5 GW to the pipeline, but the new electricity plan indicates that 12.2 GW of coal and gas power plants will be installed by 2020 (Republic of Indonesia, 2019a).
The National Energy Policy (NEP), mentioned in the NDC, has a target to increase renewable energy to 23% of total primary energy supply (TPES) by 2025, from the 2018 share of 13% (MEMR Indonesia, 2018a). However, renewables uptake has not been consistent with this target. The total new renewable investment in 2018 was about USD 1.6 billion, while investments in upstream fossil fuels reached USD 19.3 billion (Ministry of Energy and Mining Resources, 2019).
Under current policy projections, the NEP targets will not be met: the assumed role of coal in our projections is stronger than what it would be under the NEP (read more in Assumptions). The Electricity Supply Business Plan (RUPTL) 2019–2028, published in 2019, defines a target of 56.2 GW of new capacity in the next decade (of which 35 GW will come online by the end of 2022).
Planned coal capacities under the new 2019 electricity supply plan compared with 2018 went up from 26.8 to 27.1 GW and RE from 14.9 to 16.7 GW while gas went down from 14.3 to 12.4 GW. An installed capacity of 27 GW of coal-fired power plants will emit up to 200 MtCO2e/year (depending on capacity factor and efficiency). It is unclear how these targets relate to the new RPJMN, but unless the coal plants are shut down before the end of their lifetime, they will continue to emit similar amounts over the next several decades.
An analysis shows that, in order to meet the goals of the Paris Agreement, coal-fired installed capacity in Indonesia would need to decrease to about 10% of its current installed capacity before 2030 (Cui et al., 2019). Indonesia would need to phase out coal by 2040 to be consistent with the Paris Agreement (Climate Action Tracker, n.d.; Climate Analytics, 2019).
This fossil fuel expansion is likely to bind the country to a carbon-intensive power sector for many decades. However, coal power expansion plans are increasingly under question. Energy demand seems to be growing at a slower pace than projected (Republic of Indonesia, 2018e, 2019b; The Jakata Post, 2018). Also, multiple stakeholders involved in the approval of coal-fired power plants have been involved in corruption schemes which casts doubt on the decision-making process, especially for projects close to brown coal mines (Hans Nicholas Jong, 2018).
The financial agreements for coal-fired power plants increase risk of locking-in costly capacity payments to thermal power plants while renewables become cheaper. The agreements between the state electricity company (PLN) and independent power producers (IPPs) ensure a minimum payment for each kilowatt available–not necessarily dispatched. These values might reach up to 40% of the tariff value that the government needs to pay to IPPs during the duration of the whole contract and are estimated to lead to an obligation to pay over USD 16 billion for coal idle capacity until 2026 (IEEFA, 2017).
For power generation, hydropower remains the biggest source of renewable electricity, reaching a total installed capacity of approximately 5.6 GW at the end of 2018, followed by geothermal and bioenergy with almost 2.0 GW each (IRENA, 2019). Solar and wind reached together 137 MW with the opening of the 75 MW country’s first wind farm (Sidrap) in 2018 (Hajramurni, 2018; Ministry of Energy and Mining Resources, 2019).
The total renewable installed capacity in 2018 reached 9.5 GW in the end of 2018 which is quite below the government target of 15.5 GW for the same year (Suharsono et al., 2019). The Jenoponto wind farm, the second biggest one in the country with 72 MW, started operations in September 2019 (CNBC Indonesia, 2019).
Indonesia’s biofuel blending target of 20% also applies to power plants running on oil and is among the most ambitious mandates globally (ICCT, 2016) and helps the country avoid foreign exchange costs. However, there are issues around the impact on deforestation since Indonesia’s palm oil crops for biofuels are exempt from compliance with Indonesian Sustainable Palm Oil (ISPO) certification scheme (ICCT, 2016) (see below under Transport, and Agriculture).
Industry
Cement, ammonia-based fertilisers and metal industries are the largest emitting industry subsectors in Indonesia (Republic of Indonesia, 2018d). The Indonesian government is focussed on reducing cement industry emissions by lowering clinker-to-cement ratio (Republic of Indonesia, 2018a). Voluntary guidelines have been developed to encourage the use of blended cement by using clinker substitutes such as fly ash, and by using biomass and other alternative fuel and raw materials (AFR) in the cement production process. Indonesia also has various CDM projects in the industry sector, ranging from clinker replacement in the cement industry to oil field flaring reduction (UNFCCC, 2018). In addition, there are plans for energy audits and conservation for all energy intensive industries (Republic of Indonesia, 2018d).
The CAT has not quantified the impact of those policies separately. The Third National Communication shows minor reductions for the year 2020 in comparison to the emissions reductions in other sectors.
Transport
Biofuels
Indonesia’s biofuel blending mandate is one of the most ambitious in the world. Since 2016, the electricity sector must have 30% of the energy supplied by biofuels. Micro-business, fisheries, agriculture, transportation, industry and public service sectors, need at least a 20% share. The mandate has been continuously refined since its inception in 2006, which resulted in an increase in the share of road transport fuelled by biofuels, even though it is still well below the blending mandate of 30% (see chart below). In the same regulation, the target share values for all sectors are set to reach 30% by 2020 (ESDM, 2015; ICCT, 2016). While Indonesia’s biofuels targets are ambitious, they are not without controversy due to concerns with palm oil production (see Agriculture section).
Electric Vehicles
In the face of increasing concerns about air pollution, Indonesia is shifting its attention towards electric vehicles (EVs). An Electric Vehicles Development Plan and Targets is part of the General Plan of National Energy published in 2017 (Republic of Indonesia, 2017). This plan presents the vision of over 2,000 EVs, 700,000 hybrids, and over two million electric two-wheelers on the streets by 2025; these numbers increase to four, eight, and 13 million by 2050.
In 2019, the government issued a regulation to boost the domestic electric vehicle (EV) industry and to support reaching these targets. The government also wants to have 20% of all the vehicles produced domestically to be low-carbon by 2025 (Indonesia Investments, 2018).
Regulation 55/2019 is the first attempt to grow a new market by providing incentives to manufacturers and consumers, although the specifics are still not well defined. The regulation provides targets for the local content share required to reach 80%, by 2026 for two or three wheeled-vehicles and by 2030 for four wheelers; it also indicates that charging stations can be privately owned (President of the Republic of Indonesia, 2019).
The government has also included a strategic plan to develop charging infrastructure in their most recent electricity supply plan (Republic of Indonesia, 2019b) and aims to have 1,000 charging stations around the country by 2025 (APERC, 2019). PLN, the state electricity company, wants to have 52 fast charging stations in Jakarta by 2020 (Silviana, 2019).
Transport infrastructure & public transit
Mitigation actions on transport infrastructure and planning in Indonesia are being guided by the Transportation Decree No. 201/2013 (Climate Policy Database, 2013) and include a major overhaul of the existing system with an "avoid, shift and improve" approach, including the construction of Bus Rapid Transit (BRT) corridors, implementation of traffic management technologies to reduce congestion, and construction of urban railway systems (Republic of Indonesia, 2018a). The Sustainable Urban Transport Program (SUTRI) Nationally Appropriate Mitigation Action (NAMA) is being implemented in seven pilot cities and will be a key instrument to support transformation in the transport sector. The NAMA aims to improve public transport and implement transport demand management measures, e.g. road pricing and public bicycle schemes (Ministry of Transportation, 2014).
The Indonesian capital, Jakarta, has approximately one million commuters every day. The city’s Transport Master Plan states that public transport should reach 60% of the road transport modal split by 2029 (Republic of Indonesia, 2018f). In March 2019, the first line of Jakarta’s Mass Rapid Transit system opened. The project was supported by Japanese financing. A second line is expected to be completed by 2024. A key challenge now is securing the modal shift in commuter habits. The transit system is currently only used by 20% of commuters.
Buildings
The growing middle-class demands for infrastructure mean a continued relevance of the building sector in Indonesia. Emissions per capita in the sector have more than tripled since 1990 (see chart below). To mitigate the impacts of growing demand, the Indonesian government has set targets to reduce total final energy consumption in the buildings sector (both commercial and housing) by 15% compared to a BAU by 2025 (ASEAN Centre for Energy & GIZ, 2018).
Regulation 36/2005 under Law No. 28/2002 sets energy standards for buildings (SNI) concerning building envelop, air conditioning, lighting appliances, and energy audit procedure (GBPN, 2013). Also, Energy Performance Certificates are mandated for building users whose energy consumption is beyond 6,000 toe/year. These users are required to conduct an energy audit and implement its recommendation, and report result of the implementation energy measures to the government. Indonesia also has a mandatory labelling for lighting ballasts (since 2011), MEPS and mandatory labelling for air conditioning (since 2016) that are also under development for refrigeration, cooking, washing machines, dishwashers and motors (CLASP, 2018; IEA, 2016). In addition, municipal actors have been active in promoting green building concepts. In 2012, Jakarta passed a mandatory Green Building regulation. Compliance with energy conservation and efficiency regulations for large buildings that is reinforced through the issuance of building permits and the shutdown of buildings that do not comply with the established criteria (ASEAN Centre for Energy & GIZ, 2018).
Agriculture
The demand for biofuels has impacts on the agricultural and land use sector, as this demand may be met by expanding domestic palm oil industries. We have only quantified the impact the biofuels mandate would have in the transport under our current policy projection, but have included lifecycle emissions when assessing emissions reduction impact (see Assumptions).
While oil palm plantations in Indonesia are required to be ISPO-certified (Indonesian Sustainable Palm Oil), plantations for biofuel production are specifically exempt from this. As the total area of palm oil plantations in Indonesia has risen more than tenfold in the period 1990–2015 (US Department of Agriculture, 2016), while forest cover declined by about 20% (World Bank, 2015), production of biofuels from palm oil is “predicated on a vision of biofuel expansion that would require extensive deforestation” (ICCT, 2016).
Options to prevent this could require incentivising the creation of new palm oil plantations only on degraded lands, or support biofuel production from oil palm residues (ICCT, 2016). Since 2011, the government has had a palm-oil moratorium on new palm oil plantations in an area of 66 Mha. This moratorium has since been renewed, but the president has now issued a presidential instruction making it permanent (Diela, 2019). The efficacy of the moratorium is ambiguous: while the policy is considered to be a good instrument to limit future deforestation in Indonesia (Mosnier et al., 2017) some research shows that since it was implemented deforestation has increased (Greenpeace Southeast Asia, 2019). The policy can only be successful if properly enforced.
As of January 2019, suppliers involved in deforestation are suspended from sourcing to Wilmar International (Wilmar International, 2018). This decision brings pressure on the government and industry to create more sustainable supply chains in Indonesia. The European Union, the second largest importer of Indonesian palm oil, is also supporting the country’s efforts to achieve sustainable palm oil by 2020 by working on strengthening and promoting existing schemes (EU, 2019).
Also, in 2018, Indonesia implemented a policy that mandates all state crops to maintain sustainable practices including banning the use of fire for land clearing (Republic of Indonesia, 2018a). The government allocates its highest agriculture mitigation target to developing palm plantation areas on non-forested land/abandoned land/ degraded land/other use areas, but the exact approach to achieving this is neither well-explained nor easily traceable (Republic of Indonesia, 2018d).
Forestry
Indonesia alone contributed to 7% of the total global tree cover loss between 2001 and 2018 (Global Forest Watch, 2019) and contributes to a large share of LULUCF emissions reaching around 1 GtCO2e/year, considering deforestation, forest degradation, peat decomposition, and peat fires (Alisjahbana & Busch, 2017; UNFCCC, 2015). Due to an unusually high occurrence of peat fires, the emissions from the LULUCF sector in Indonesia reached almost 1.5 GtCO2 in 2015. To put that in context: global emissions from LULUCF were about 4.1 GtCO2e in 2016. Assessing a LULUCF emissions trajectory is somewhat complicated by the fact that these emissions have shown large fluctuations due, among other things, to the variability of emissions from peat fires to external factors such as the influence by El Niño. In the chart below we present the historical data according to country reported information and current policy projections range made by a third party consortium (Kuramochi et al., 2018).
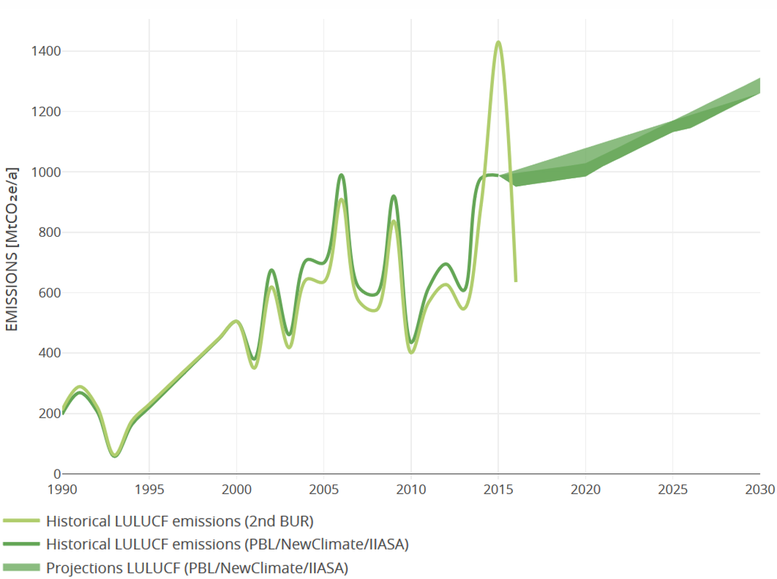
In 2019, the Indonesian fires were again a special reason for concern: in just the one week of 13 September there were more than 70,000 fire alerts in the country (Global Forest Watch, 2019) causing a state of emergency in at least six Indonesian provinces and sparking complaints from neighbouring countries that were affected by the toxic haze (Walden, 2019). In 2018, about 1.2 Mha of Indonesia’s forests were lost compared to 2.42 Mha in 2016 and 1.3 Mha in 2017. While this reduction is a good sign, the biggest driver for deforestation is still commodity-driven deforestation (Global Forest Watch, 2019).
We made separate analyses of Indonesia’s LULUCF emissions in our 2015 and 2016 assessments. LULUCF emissions are a huge uncertainty factor in assessing the extent to which Indonesia is in line with meeting its NDC. The CAT does not assess the LULUCF component of the NDC; however, both conditional and unconditional targets depend heavily on the forestry sector. It compromises about 60% of the emissions reduction effort.
Emissions from this sector are projected to increase by at least 300 MtCO2e between 2020 and 2030, as presented in the current policies chart (Kuramochi et al., 2017, 2018), which takes Indonesia even further from reaching its sector NDC targets which, if they were to be met, require a decrease in LULUCF emissions. If the sector is taken into account, more ambitious actions would be needed to reach the NDC targets considering both the reinforcement and expansion of the current forestry moratorium (Wijaya et al., 2017).
As part of the National Action Plan for Greenhouse Gas Emission Reduction (RAN-GRK), Indonesia identified actions in the forestry sector. Those are sustainable peat land management, reducing the deforestation and land degradation rate, and developing carbon sequestration projects in forestry and agriculture (Mersmann et al., 2017).
These efforts are reinforced through the REDD+ Task Force, which in the short and medium term focuses on improving governance of forests, and in the long term aims at turning Indonesia’s forests and lands into a net carbon sink (ibid). In the Third National Communication, Indonesia describes 13 “core mitigation plans” that have been pursued since 2010, each with a quantitative emission reduction target attributed to them. All targets add up to reductions of 810 MtCO2e/year. The CAT does not quantify the expected impact itself.
Laws in place to regulate the sector are the moratorium for new permits and improvement of forest and peatland governance and the National Strategy for Forest Law Enforcement in Indonesia from 2005, a programme to combat illegal logging. The policy constitutes not just a freeze on new licenses, but an order for the relevant central government ministries and regional governments to conduct a massive review of palm oil licensing data. Indonesia is also pursuing the One Map Policy, with the objective to create a transparent monitoring system of forest areas (Mulyani & Jepson, 2016).
Further analysis
Country-related publications


Stay informed
Subscribe to our newsletter